Ecuadorian vs Asian High School Diploma
COMPARE
Ecuadorian
Asian
High School Diploma
High School Diploma Comparison
Ecuadorians
Asians
85.1%
HIGH SCHOOL DIPLOMA
0.0/ 100
METRIC RATING
311th/ 347
METRIC RANK
89.4%
HIGH SCHOOL DIPLOMA
70.7/ 100
METRIC RATING
152nd/ 347
METRIC RANK
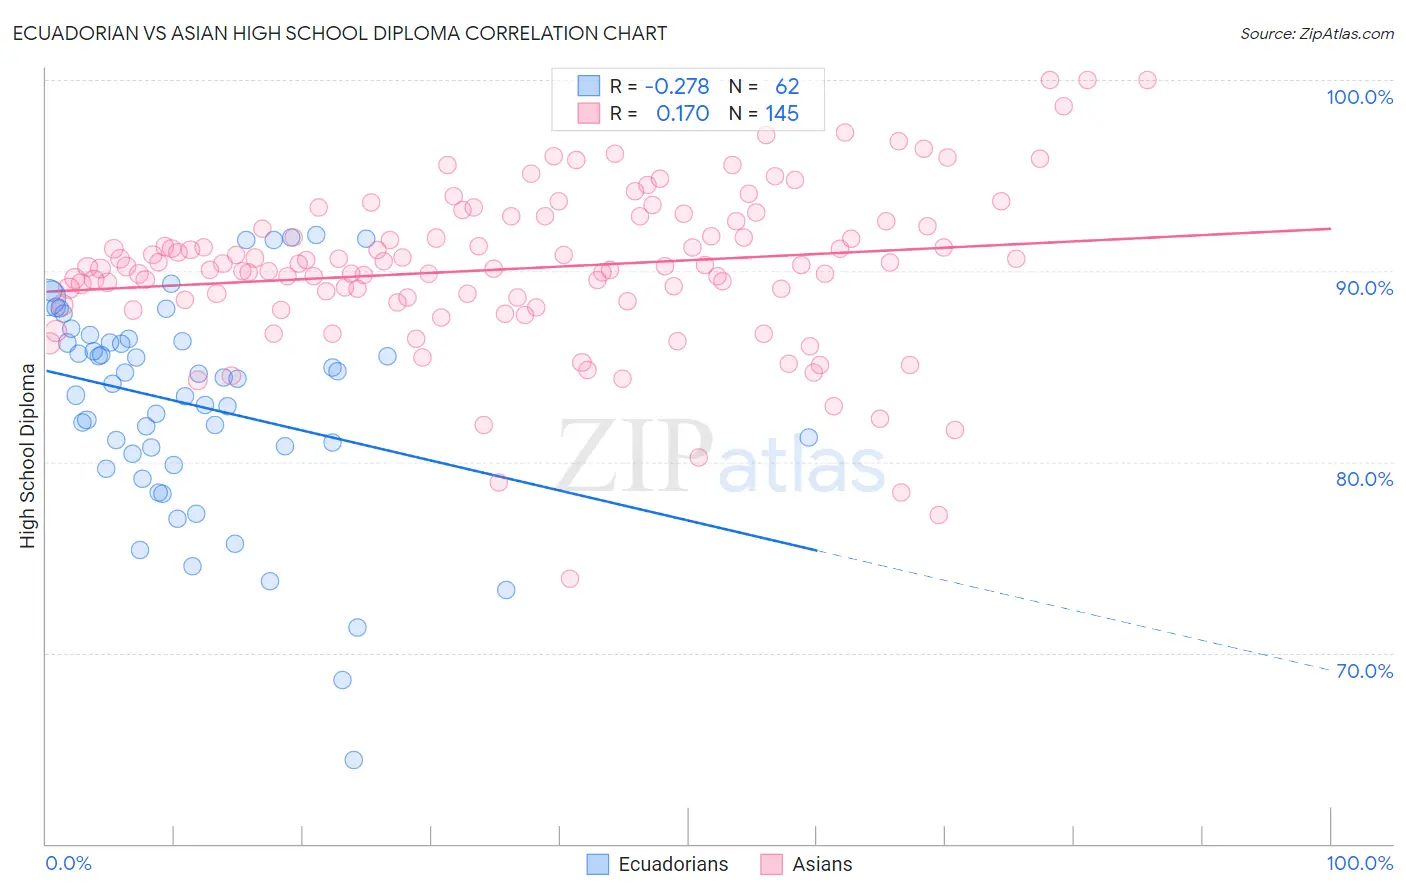
Ecuadorian vs Asian High School Diploma Correlation Chart
The statistical analysis conducted on geographies consisting of 317,865,755 people shows a weak negative correlation between the proportion of Ecuadorians and percentage of population with at least high school diploma education in the United States with a correlation coefficient (R) of -0.278 and weighted average of 85.1%. Similarly, the statistical analysis conducted on geographies consisting of 550,718,935 people shows a poor positive correlation between the proportion of Asians and percentage of population with at least high school diploma education in the United States with a correlation coefficient (R) of 0.170 and weighted average of 89.4%, a difference of 5.1%.
High School Diploma Correlation Summary
| Measurement | Ecuadorian | Asian |
| Minimum | 64.4% | 73.8% |
| Maximum | 91.9% | 100.0% |
| Range | 27.5% | 26.2% |
| Mean | 83.0% | 90.1% |
| Median | 84.2% | 90.2% |
| Interquartile 25% (IQ1) | 80.4% | 88.5% |
| Interquartile 75% (IQ3) | 86.3% | 92.6% |
| Interquartile Range (IQR) | 5.9% | 4.1% |
| Standard Deviation (Sample) | 5.7% | 4.2% |
| Standard Deviation (Population) | 5.6% | 4.2% |
Similar Demographics by High School Diploma
Demographics Similar to Ecuadorians by High School Diploma
In terms of high school diploma, the demographic groups most similar to Ecuadorians are Apache (85.1%, a difference of 0.010%), Cape Verdean (85.1%, a difference of 0.050%), Immigrants from Dominica (85.2%, a difference of 0.090%), Immigrants from Armenia (85.2%, a difference of 0.10%), and Navajo (85.2%, a difference of 0.11%).
| Demographics | Rating | Rank | High School Diploma |
| Nepalese | 0.0 /100 | #304 | Tragic 85.3% |
| Immigrants | Portugal | 0.0 /100 | #305 | Tragic 85.3% |
| Immigrants | Guyana | 0.0 /100 | #306 | Tragic 85.3% |
| Navajo | 0.0 /100 | #307 | Tragic 85.2% |
| Immigrants | Armenia | 0.0 /100 | #308 | Tragic 85.2% |
| Immigrants | Dominica | 0.0 /100 | #309 | Tragic 85.2% |
| Apache | 0.0 /100 | #310 | Tragic 85.1% |
| Ecuadorians | 0.0 /100 | #311 | Tragic 85.1% |
| Cape Verdeans | 0.0 /100 | #312 | Tragic 85.1% |
| Immigrants | Ecuador | 0.0 /100 | #313 | Tragic 84.8% |
| Yaqui | 0.0 /100 | #314 | Tragic 84.7% |
| Puerto Ricans | 0.0 /100 | #315 | Tragic 84.7% |
| Belizeans | 0.0 /100 | #316 | Tragic 84.3% |
| Immigrants | Caribbean | 0.0 /100 | #317 | Tragic 84.3% |
| Immigrants | Belize | 0.0 /100 | #318 | Tragic 84.2% |
Demographics Similar to Asians by High School Diploma
In terms of high school diploma, the demographic groups most similar to Asians are Paraguayan (89.5%, a difference of 0.010%), Argentinean (89.5%, a difference of 0.030%), Immigrants from Poland (89.5%, a difference of 0.040%), Immigrants from Iraq (89.4%, a difference of 0.040%), and Immigrants from Lebanon (89.5%, a difference of 0.050%).
| Demographics | Rating | Rank | High School Diploma |
| Immigrants | Brazil | 76.6 /100 | #145 | Good 89.5% |
| Immigrants | Spain | 76.2 /100 | #146 | Good 89.5% |
| Iraqis | 73.9 /100 | #147 | Good 89.5% |
| Immigrants | Lebanon | 73.4 /100 | #148 | Good 89.5% |
| Immigrants | Poland | 72.9 /100 | #149 | Good 89.5% |
| Argentineans | 72.3 /100 | #150 | Good 89.5% |
| Paraguayans | 71.4 /100 | #151 | Good 89.5% |
| Asians | 70.7 /100 | #152 | Good 89.4% |
| Immigrants | Iraq | 68.7 /100 | #153 | Good 89.4% |
| Alsatians | 66.8 /100 | #154 | Good 89.4% |
| Immigrants | Northern Africa | 66.4 /100 | #155 | Good 89.4% |
| Immigrants | Argentina | 65.5 /100 | #156 | Good 89.4% |
| Immigrants | Malaysia | 63.5 /100 | #157 | Good 89.3% |
| Immigrants | Pakistan | 62.5 /100 | #158 | Good 89.3% |
| Immigrants | China | 62.0 /100 | #159 | Good 89.3% |