Slavic vs Asian High School Diploma
COMPARE
Slavic
Asian
High School Diploma
High School Diploma Comparison
Slavs
Asians
91.0%
HIGH SCHOOL DIPLOMA
99.7/ 100
METRIC RATING
58th/ 347
METRIC RANK
89.4%
HIGH SCHOOL DIPLOMA
70.7/ 100
METRIC RATING
152nd/ 347
METRIC RANK
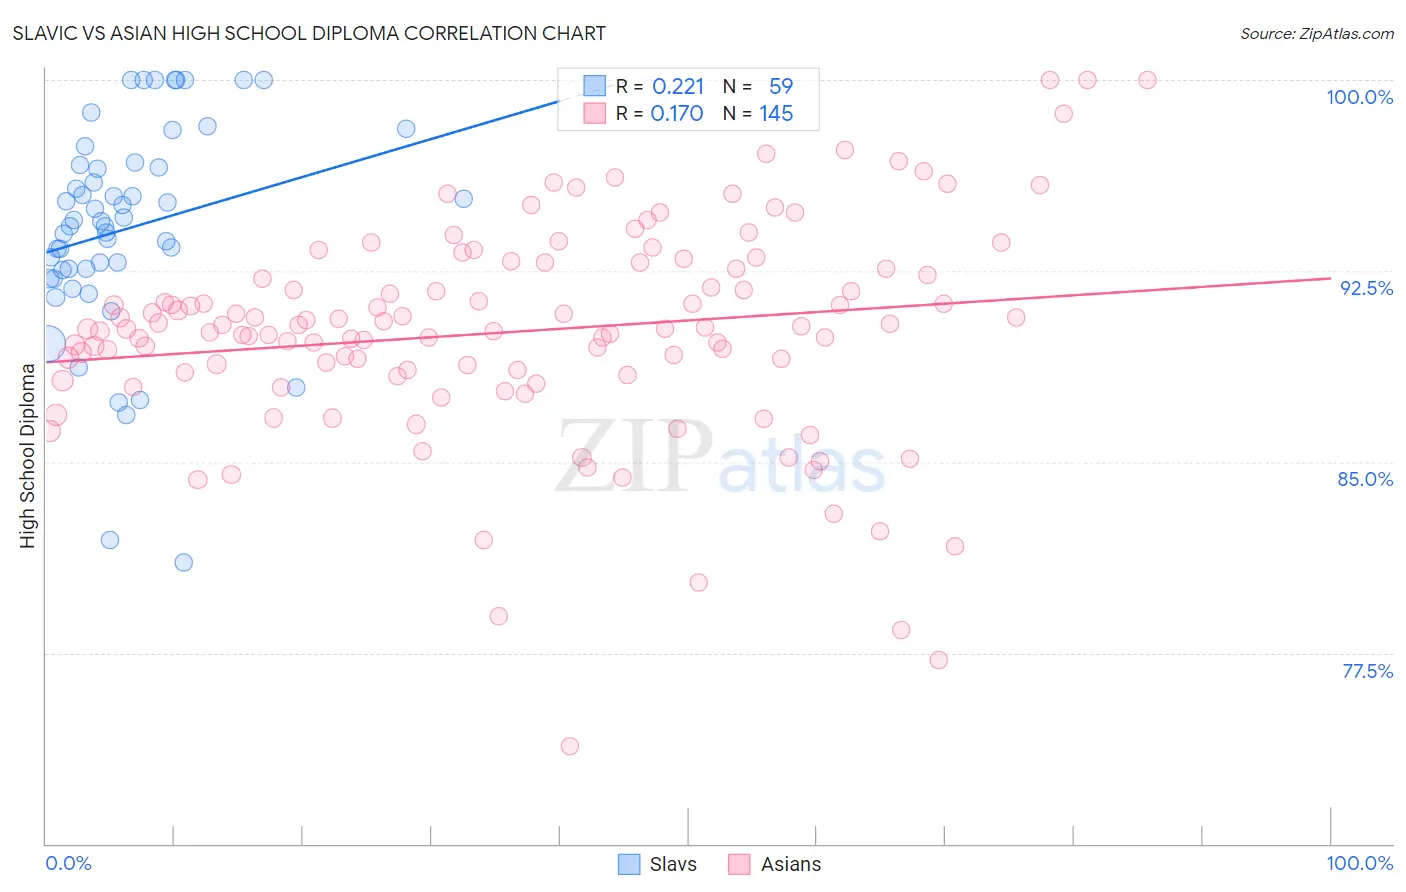
Slavic vs Asian High School Diploma Correlation Chart
The statistical analysis conducted on geographies consisting of 270,868,354 people shows a weak positive correlation between the proportion of Slavs and percentage of population with at least high school diploma education in the United States with a correlation coefficient (R) of 0.221 and weighted average of 91.0%. Similarly, the statistical analysis conducted on geographies consisting of 550,718,935 people shows a poor positive correlation between the proportion of Asians and percentage of population with at least high school diploma education in the United States with a correlation coefficient (R) of 0.170 and weighted average of 89.4%, a difference of 1.8%.
High School Diploma Correlation Summary
| Measurement | Slavic | Asian |
| Minimum | 81.0% | 73.8% |
| Maximum | 100.0% | 100.0% |
| Range | 19.0% | 26.2% |
| Mean | 94.2% | 90.1% |
| Median | 94.5% | 90.2% |
| Interquartile 25% (IQ1) | 92.6% | 88.5% |
| Interquartile 75% (IQ3) | 96.7% | 92.6% |
| Interquartile Range (IQR) | 4.1% | 4.1% |
| Standard Deviation (Sample) | 4.2% | 4.2% |
| Standard Deviation (Population) | 4.1% | 4.2% |
Similar Demographics by High School Diploma
Demographics Similar to Slavs by High School Diploma
In terms of high school diploma, the demographic groups most similar to Slavs are Immigrants from North America (91.0%, a difference of 0.0%), Zimbabwean (91.1%, a difference of 0.010%), Immigrants from Canada (91.1%, a difference of 0.030%), Immigrants from Japan (91.0%, a difference of 0.030%), and Immigrants from Taiwan (91.0%, a difference of 0.040%).
| Demographics | Rating | Rank | High School Diploma |
| New Zealanders | 99.7 /100 | #51 | Exceptional 91.1% |
| Immigrants | Sweden | 99.7 /100 | #52 | Exceptional 91.1% |
| Immigrants | Belgium | 99.7 /100 | #53 | Exceptional 91.1% |
| Macedonians | 99.7 /100 | #54 | Exceptional 91.1% |
| Serbians | 99.7 /100 | #55 | Exceptional 91.1% |
| Immigrants | Canada | 99.7 /100 | #56 | Exceptional 91.1% |
| Zimbabweans | 99.7 /100 | #57 | Exceptional 91.1% |
| Slavs | 99.7 /100 | #58 | Exceptional 91.0% |
| Immigrants | North America | 99.7 /100 | #59 | Exceptional 91.0% |
| Immigrants | Japan | 99.6 /100 | #60 | Exceptional 91.0% |
| Immigrants | Taiwan | 99.6 /100 | #61 | Exceptional 91.0% |
| Austrians | 99.6 /100 | #62 | Exceptional 91.0% |
| Immigrants | Netherlands | 99.6 /100 | #63 | Exceptional 91.0% |
| Ukrainians | 99.6 /100 | #64 | Exceptional 91.0% |
| Immigrants | South Africa | 99.6 /100 | #65 | Exceptional 91.0% |
Demographics Similar to Asians by High School Diploma
In terms of high school diploma, the demographic groups most similar to Asians are Paraguayan (89.5%, a difference of 0.010%), Argentinean (89.5%, a difference of 0.030%), Immigrants from Poland (89.5%, a difference of 0.040%), Immigrants from Iraq (89.4%, a difference of 0.040%), and Immigrants from Lebanon (89.5%, a difference of 0.050%).
| Demographics | Rating | Rank | High School Diploma |
| Immigrants | Brazil | 76.6 /100 | #145 | Good 89.5% |
| Immigrants | Spain | 76.2 /100 | #146 | Good 89.5% |
| Iraqis | 73.9 /100 | #147 | Good 89.5% |
| Immigrants | Lebanon | 73.4 /100 | #148 | Good 89.5% |
| Immigrants | Poland | 72.9 /100 | #149 | Good 89.5% |
| Argentineans | 72.3 /100 | #150 | Good 89.5% |
| Paraguayans | 71.4 /100 | #151 | Good 89.5% |
| Asians | 70.7 /100 | #152 | Good 89.4% |
| Immigrants | Iraq | 68.7 /100 | #153 | Good 89.4% |
| Alsatians | 66.8 /100 | #154 | Good 89.4% |
| Immigrants | Northern Africa | 66.4 /100 | #155 | Good 89.4% |
| Immigrants | Argentina | 65.5 /100 | #156 | Good 89.4% |
| Immigrants | Malaysia | 63.5 /100 | #157 | Good 89.3% |
| Immigrants | Pakistan | 62.5 /100 | #158 | Good 89.3% |
| Immigrants | China | 62.0 /100 | #159 | Good 89.3% |