Liberian vs Immigrants from Israel Nursery School
COMPARE
Liberian
Immigrants from Israel
Nursery School
Nursery School Comparison
Liberians
Immigrants from Israel
97.7%
NURSERY SCHOOL
1.1/ 100
METRIC RATING
242nd/ 347
METRIC RANK
98.1%
NURSERY SCHOOL
78.5/ 100
METRIC RATING
145th/ 347
METRIC RANK
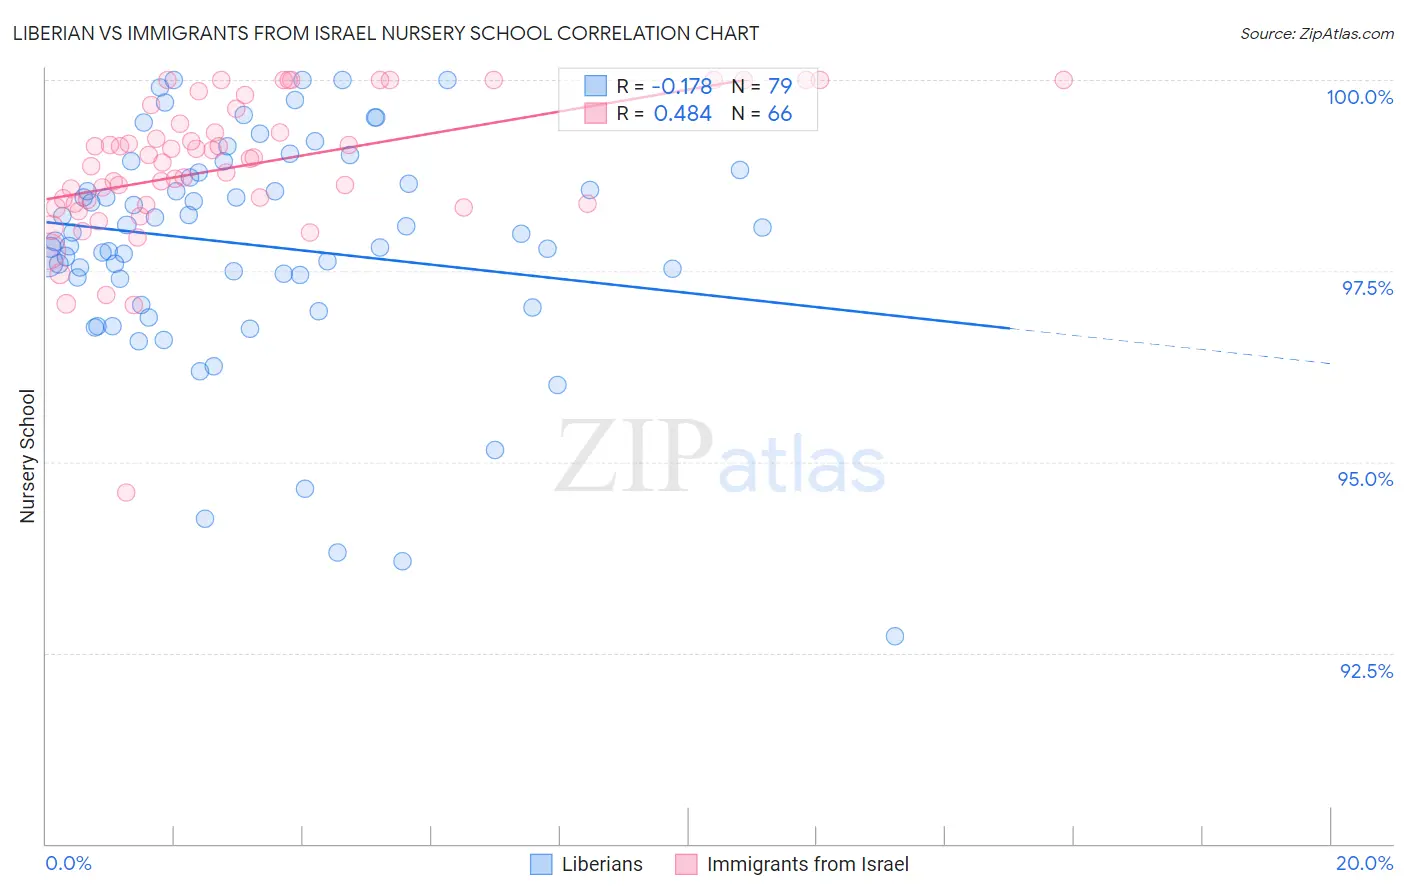
Liberian vs Immigrants from Israel Nursery School Correlation Chart
The statistical analysis conducted on geographies consisting of 118,100,194 people shows a poor negative correlation between the proportion of Liberians and percentage of population with at least nursery school education in the United States with a correlation coefficient (R) of -0.178 and weighted average of 97.7%. Similarly, the statistical analysis conducted on geographies consisting of 210,029,773 people shows a moderate positive correlation between the proportion of Immigrants from Israel and percentage of population with at least nursery school education in the United States with a correlation coefficient (R) of 0.484 and weighted average of 98.1%, a difference of 0.44%.
Nursery School Correlation Summary
| Measurement | Liberian | Immigrants from Israel |
| Minimum | 92.7% | 94.6% |
| Maximum | 100.0% | 100.0% |
| Range | 7.3% | 5.4% |
| Mean | 97.8% | 98.9% |
| Median | 98.0% | 99.0% |
| Interquartile 25% (IQ1) | 97.4% | 98.4% |
| Interquartile 75% (IQ3) | 98.8% | 99.6% |
| Interquartile Range (IQR) | 1.4% | 1.2% |
| Standard Deviation (Sample) | 1.5% | 0.95% |
| Standard Deviation (Population) | 1.5% | 0.94% |
Similar Demographics by Nursery School
Demographics Similar to Liberians by Nursery School
In terms of nursery school, the demographic groups most similar to Liberians are Immigrants from Indonesia (97.7%, a difference of 0.0%), Asian (97.6%, a difference of 0.0%), South American (97.6%, a difference of 0.010%), Bolivian (97.6%, a difference of 0.010%), and Peruvian (97.6%, a difference of 0.010%).
| Demographics | Rating | Rank | Nursery School |
| Immigrants | Pakistan | 2.1 /100 | #235 | Tragic 97.7% |
| Immigrants | Malaysia | 1.9 /100 | #236 | Tragic 97.7% |
| Immigrants | Western Asia | 1.9 /100 | #237 | Tragic 97.7% |
| Nigerians | 1.7 /100 | #238 | Tragic 97.7% |
| Immigrants | Eastern Asia | 1.6 /100 | #239 | Tragic 97.7% |
| Koreans | 1.4 /100 | #240 | Tragic 97.7% |
| Immigrants | Indonesia | 1.1 /100 | #241 | Tragic 97.7% |
| Liberians | 1.1 /100 | #242 | Tragic 97.7% |
| Asians | 1.1 /100 | #243 | Tragic 97.6% |
| South Americans | 1.0 /100 | #244 | Tragic 97.6% |
| Bolivians | 1.0 /100 | #245 | Tragic 97.6% |
| Peruvians | 1.0 /100 | #246 | Tragic 97.6% |
| Immigrants | Middle Africa | 0.9 /100 | #247 | Tragic 97.6% |
| Indians (Asian) | 0.9 /100 | #248 | Tragic 97.6% |
| Immigrants | Eastern Africa | 0.9 /100 | #249 | Tragic 97.6% |
Demographics Similar to Immigrants from Israel by Nursery School
In terms of nursery school, the demographic groups most similar to Immigrants from Israel are Filipino (98.1%, a difference of 0.0%), Burmese (98.1%, a difference of 0.010%), Marshallese (98.1%, a difference of 0.010%), Alsatian (98.1%, a difference of 0.010%), and Hmong (98.1%, a difference of 0.010%).
| Demographics | Rating | Rank | Nursery School |
| Immigrants | Romania | 88.0 /100 | #138 | Excellent 98.1% |
| Blackfeet | 87.5 /100 | #139 | Excellent 98.1% |
| Palestinians | 83.7 /100 | #140 | Excellent 98.1% |
| Immigrants | Turkey | 83.0 /100 | #141 | Excellent 98.1% |
| Burmese | 81.7 /100 | #142 | Excellent 98.1% |
| Marshallese | 81.2 /100 | #143 | Excellent 98.1% |
| Alsatians | 80.3 /100 | #144 | Excellent 98.1% |
| Immigrants | Israel | 78.5 /100 | #145 | Good 98.1% |
| Filipinos | 78.5 /100 | #146 | Good 98.1% |
| Hmong | 75.7 /100 | #147 | Good 98.1% |
| Immigrants | Greece | 75.4 /100 | #148 | Good 98.1% |
| Apache | 73.2 /100 | #149 | Good 98.1% |
| Jordanians | 72.9 /100 | #150 | Good 98.1% |
| Soviet Union | 71.6 /100 | #151 | Good 98.0% |
| Dutch West Indians | 70.2 /100 | #152 | Good 98.0% |