Liberian vs Immigrants from Zimbabwe Nursery School
COMPARE
Liberian
Immigrants from Zimbabwe
Nursery School
Nursery School Comparison
Liberians
Immigrants from Zimbabwe
97.7%
NURSERY SCHOOL
1.1/ 100
METRIC RATING
242nd/ 347
METRIC RANK
98.2%
NURSERY SCHOOL
94.2/ 100
METRIC RATING
121st/ 347
METRIC RANK
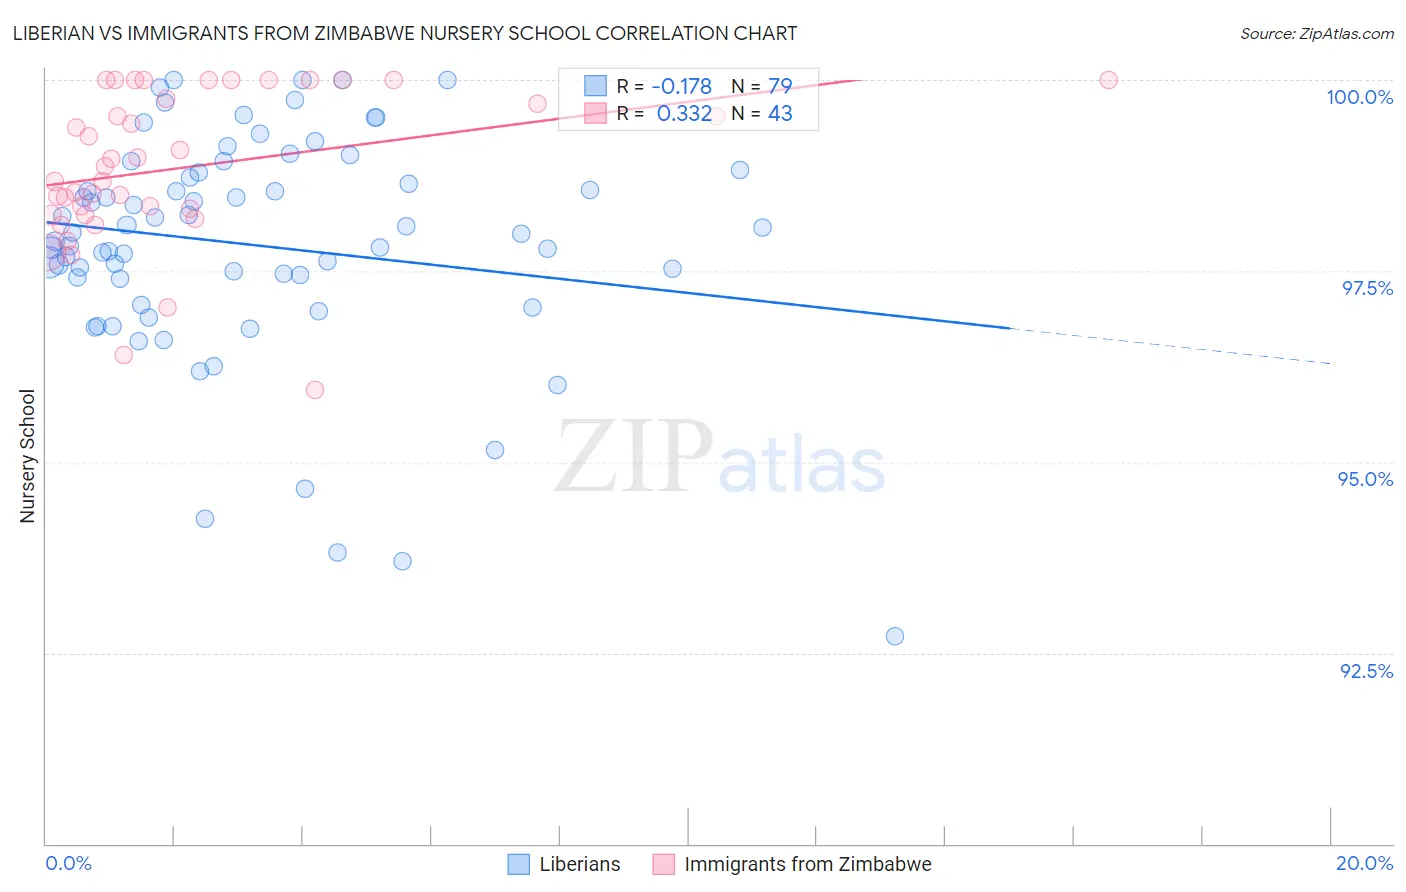
Liberian vs Immigrants from Zimbabwe Nursery School Correlation Chart
The statistical analysis conducted on geographies consisting of 118,100,194 people shows a poor negative correlation between the proportion of Liberians and percentage of population with at least nursery school education in the United States with a correlation coefficient (R) of -0.178 and weighted average of 97.7%. Similarly, the statistical analysis conducted on geographies consisting of 117,756,150 people shows a mild positive correlation between the proportion of Immigrants from Zimbabwe and percentage of population with at least nursery school education in the United States with a correlation coefficient (R) of 0.332 and weighted average of 98.2%, a difference of 0.55%.
Nursery School Correlation Summary
| Measurement | Liberian | Immigrants from Zimbabwe |
| Minimum | 92.7% | 95.9% |
| Maximum | 100.0% | 100.0% |
| Range | 7.3% | 4.1% |
| Mean | 97.8% | 98.9% |
| Median | 98.0% | 98.9% |
| Interquartile 25% (IQ1) | 97.4% | 98.2% |
| Interquartile 75% (IQ3) | 98.8% | 100.0% |
| Interquartile Range (IQR) | 1.4% | 1.8% |
| Standard Deviation (Sample) | 1.5% | 1.0% |
| Standard Deviation (Population) | 1.5% | 1.00% |
Similar Demographics by Nursery School
Demographics Similar to Liberians by Nursery School
In terms of nursery school, the demographic groups most similar to Liberians are Immigrants from Indonesia (97.7%, a difference of 0.0%), Asian (97.6%, a difference of 0.0%), South American (97.6%, a difference of 0.010%), Bolivian (97.6%, a difference of 0.010%), and Peruvian (97.6%, a difference of 0.010%).
| Demographics | Rating | Rank | Nursery School |
| Immigrants | Pakistan | 2.1 /100 | #235 | Tragic 97.7% |
| Immigrants | Malaysia | 1.9 /100 | #236 | Tragic 97.7% |
| Immigrants | Western Asia | 1.9 /100 | #237 | Tragic 97.7% |
| Nigerians | 1.7 /100 | #238 | Tragic 97.7% |
| Immigrants | Eastern Asia | 1.6 /100 | #239 | Tragic 97.7% |
| Koreans | 1.4 /100 | #240 | Tragic 97.7% |
| Immigrants | Indonesia | 1.1 /100 | #241 | Tragic 97.7% |
| Liberians | 1.1 /100 | #242 | Tragic 97.7% |
| Asians | 1.1 /100 | #243 | Tragic 97.6% |
| South Americans | 1.0 /100 | #244 | Tragic 97.6% |
| Bolivians | 1.0 /100 | #245 | Tragic 97.6% |
| Peruvians | 1.0 /100 | #246 | Tragic 97.6% |
| Immigrants | Middle Africa | 0.9 /100 | #247 | Tragic 97.6% |
| Indians (Asian) | 0.9 /100 | #248 | Tragic 97.6% |
| Immigrants | Eastern Africa | 0.9 /100 | #249 | Tragic 97.6% |
Demographics Similar to Immigrants from Zimbabwe by Nursery School
In terms of nursery school, the demographic groups most similar to Immigrants from Zimbabwe are Okinawan (98.2%, a difference of 0.0%), Immigrants from Japan (98.2%, a difference of 0.0%), Syrian (98.2%, a difference of 0.0%), Thai (98.2%, a difference of 0.010%), and Lebanese (98.2%, a difference of 0.010%).
| Demographics | Rating | Rank | Nursery School |
| Ute | 96.4 /100 | #114 | Exceptional 98.2% |
| Iranians | 96.3 /100 | #115 | Exceptional 98.2% |
| Spanish | 95.8 /100 | #116 | Exceptional 98.2% |
| Immigrants | France | 95.6 /100 | #117 | Exceptional 98.2% |
| Yugoslavians | 95.4 /100 | #118 | Exceptional 98.2% |
| Thais | 95.0 /100 | #119 | Exceptional 98.2% |
| Okinawans | 94.5 /100 | #120 | Exceptional 98.2% |
| Immigrants | Zimbabwe | 94.2 /100 | #121 | Exceptional 98.2% |
| Immigrants | Japan | 94.0 /100 | #122 | Exceptional 98.2% |
| Syrians | 93.9 /100 | #123 | Exceptional 98.2% |
| Lebanese | 93.8 /100 | #124 | Exceptional 98.2% |
| Iroquois | 93.7 /100 | #125 | Exceptional 98.2% |
| Menominee | 93.6 /100 | #126 | Exceptional 98.2% |
| Immigrants | Saudi Arabia | 93.4 /100 | #127 | Exceptional 98.2% |
| Immigrants | Serbia | 92.4 /100 | #128 | Exceptional 98.2% |