Liberian vs South African Nursery School
COMPARE
Liberian
South African
Nursery School
Nursery School Comparison
Liberians
South Africans
97.7%
NURSERY SCHOOL
1.1/ 100
METRIC RATING
242nd/ 347
METRIC RANK
98.3%
NURSERY SCHOOL
98.6/ 100
METRIC RATING
95th/ 347
METRIC RANK
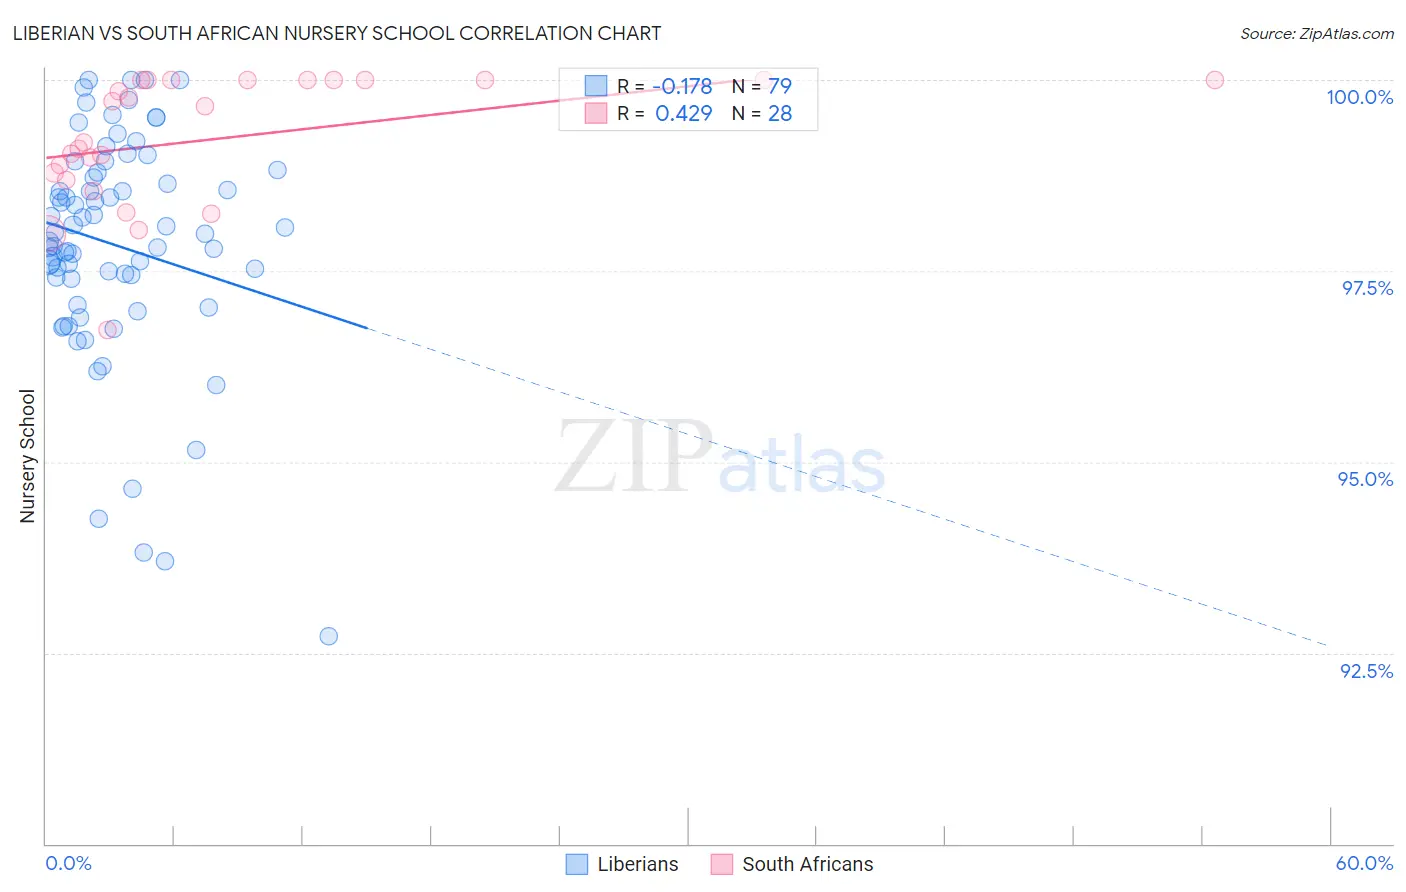
Liberian vs South African Nursery School Correlation Chart
The statistical analysis conducted on geographies consisting of 118,100,194 people shows a poor negative correlation between the proportion of Liberians and percentage of population with at least nursery school education in the United States with a correlation coefficient (R) of -0.178 and weighted average of 97.7%. Similarly, the statistical analysis conducted on geographies consisting of 182,602,894 people shows a moderate positive correlation between the proportion of South Africans and percentage of population with at least nursery school education in the United States with a correlation coefficient (R) of 0.429 and weighted average of 98.3%, a difference of 0.66%.
Nursery School Correlation Summary
| Measurement | Liberian | South African |
| Minimum | 92.7% | 96.7% |
| Maximum | 100.0% | 100.0% |
| Range | 7.3% | 3.3% |
| Mean | 97.8% | 99.2% |
| Median | 98.0% | 99.4% |
| Interquartile 25% (IQ1) | 97.4% | 98.7% |
| Interquartile 75% (IQ3) | 98.8% | 100.0% |
| Interquartile Range (IQR) | 1.4% | 1.3% |
| Standard Deviation (Sample) | 1.5% | 0.85% |
| Standard Deviation (Population) | 1.5% | 0.83% |
Similar Demographics by Nursery School
Demographics Similar to Liberians by Nursery School
In terms of nursery school, the demographic groups most similar to Liberians are Immigrants from Indonesia (97.7%, a difference of 0.0%), Asian (97.6%, a difference of 0.0%), South American (97.6%, a difference of 0.010%), Bolivian (97.6%, a difference of 0.010%), and Peruvian (97.6%, a difference of 0.010%).
| Demographics | Rating | Rank | Nursery School |
| Immigrants | Pakistan | 2.1 /100 | #235 | Tragic 97.7% |
| Immigrants | Malaysia | 1.9 /100 | #236 | Tragic 97.7% |
| Immigrants | Western Asia | 1.9 /100 | #237 | Tragic 97.7% |
| Nigerians | 1.7 /100 | #238 | Tragic 97.7% |
| Immigrants | Eastern Asia | 1.6 /100 | #239 | Tragic 97.7% |
| Koreans | 1.4 /100 | #240 | Tragic 97.7% |
| Immigrants | Indonesia | 1.1 /100 | #241 | Tragic 97.7% |
| Liberians | 1.1 /100 | #242 | Tragic 97.7% |
| Asians | 1.1 /100 | #243 | Tragic 97.6% |
| South Americans | 1.0 /100 | #244 | Tragic 97.6% |
| Bolivians | 1.0 /100 | #245 | Tragic 97.6% |
| Peruvians | 1.0 /100 | #246 | Tragic 97.6% |
| Immigrants | Middle Africa | 0.9 /100 | #247 | Tragic 97.6% |
| Indians (Asian) | 0.9 /100 | #248 | Tragic 97.6% |
| Immigrants | Eastern Africa | 0.9 /100 | #249 | Tragic 97.6% |
Demographics Similar to South Africans by Nursery School
In terms of nursery school, the demographic groups most similar to South Africans are Immigrants from Germany (98.3%, a difference of 0.0%), Zimbabwean (98.3%, a difference of 0.010%), Macedonian (98.3%, a difference of 0.010%), Immigrants from India (98.3%, a difference of 0.010%), and Cypriot (98.3%, a difference of 0.010%).
| Demographics | Rating | Rank | Nursery School |
| Ukrainians | 98.9 /100 | #88 | Exceptional 98.3% |
| Immigrants | South Africa | 98.8 /100 | #89 | Exceptional 98.3% |
| Immigrants | Western Europe | 98.8 /100 | #90 | Exceptional 98.3% |
| Zimbabweans | 98.8 /100 | #91 | Exceptional 98.3% |
| Macedonians | 98.7 /100 | #92 | Exceptional 98.3% |
| Immigrants | India | 98.7 /100 | #93 | Exceptional 98.3% |
| Immigrants | Germany | 98.6 /100 | #94 | Exceptional 98.3% |
| South Africans | 98.6 /100 | #95 | Exceptional 98.3% |
| Cypriots | 98.3 /100 | #96 | Exceptional 98.3% |
| Immigrants | Nonimmigrants | 98.3 /100 | #97 | Exceptional 98.3% |
| Choctaw | 98.3 /100 | #98 | Exceptional 98.3% |
| Colville | 98.2 /100 | #99 | Exceptional 98.3% |
| Puget Sound Salish | 98.0 /100 | #100 | Exceptional 98.3% |
| Romanians | 97.9 /100 | #101 | Exceptional 98.3% |
| Immigrants | Ireland | 97.7 /100 | #102 | Exceptional 98.3% |