Liberian vs Immigrants from Spain Nursery School
COMPARE
Liberian
Immigrants from Spain
Nursery School
Nursery School Comparison
Liberians
Immigrants from Spain
97.7%
NURSERY SCHOOL
1.1/ 100
METRIC RATING
242nd/ 347
METRIC RANK
98.0%
NURSERY SCHOOL
55.6/ 100
METRIC RATING
167th/ 347
METRIC RANK
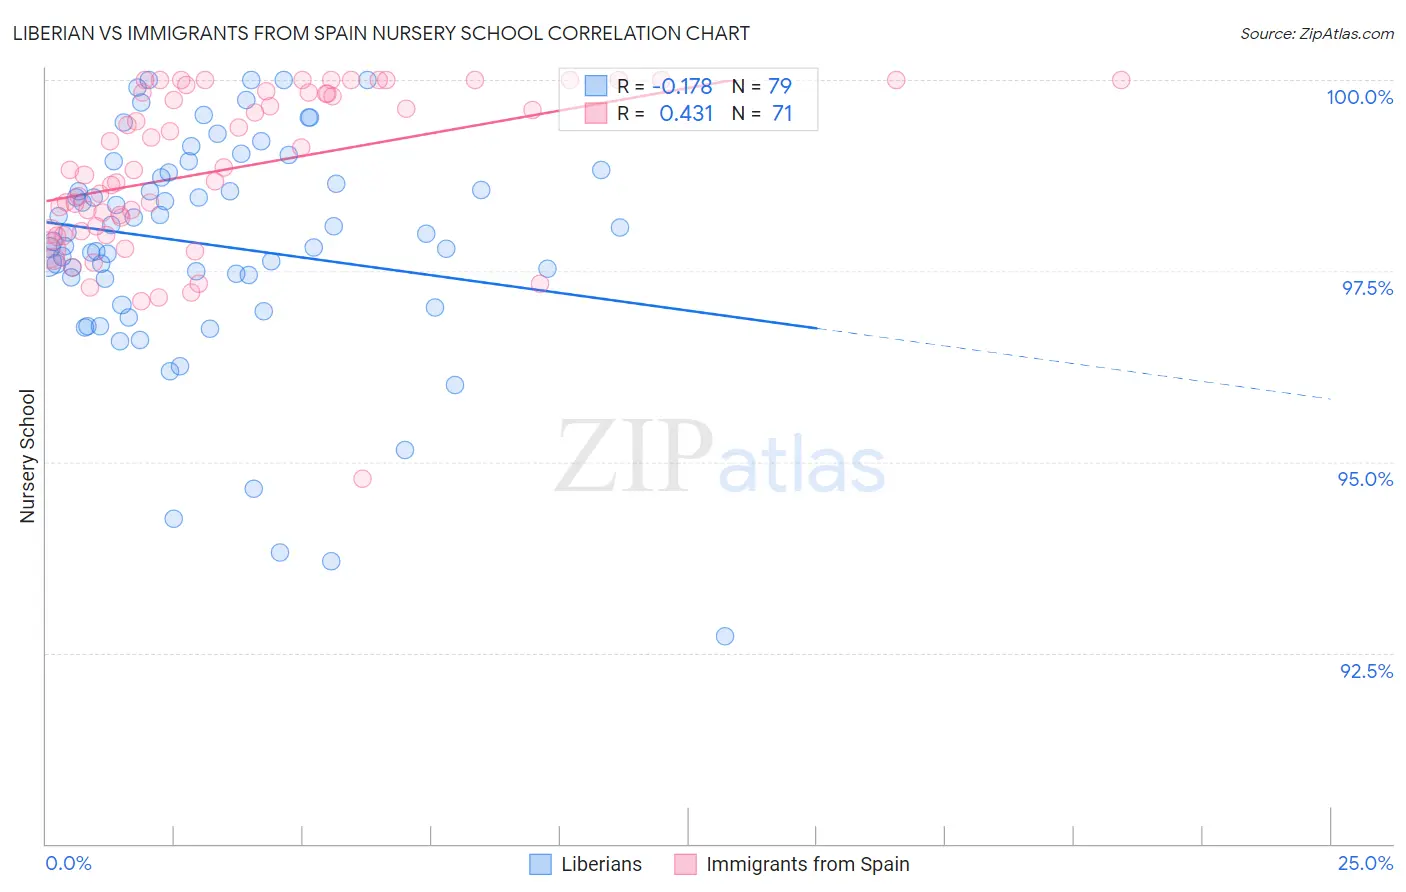
Liberian vs Immigrants from Spain Nursery School Correlation Chart
The statistical analysis conducted on geographies consisting of 118,100,194 people shows a poor negative correlation between the proportion of Liberians and percentage of population with at least nursery school education in the United States with a correlation coefficient (R) of -0.178 and weighted average of 97.7%. Similarly, the statistical analysis conducted on geographies consisting of 239,682,160 people shows a moderate positive correlation between the proportion of Immigrants from Spain and percentage of population with at least nursery school education in the United States with a correlation coefficient (R) of 0.431 and weighted average of 98.0%, a difference of 0.36%.
Nursery School Correlation Summary
| Measurement | Liberian | Immigrants from Spain |
| Minimum | 92.7% | 94.8% |
| Maximum | 100.0% | 100.0% |
| Range | 7.3% | 5.2% |
| Mean | 97.8% | 98.8% |
| Median | 98.0% | 98.8% |
| Interquartile 25% (IQ1) | 97.4% | 98.0% |
| Interquartile 75% (IQ3) | 98.8% | 99.8% |
| Interquartile Range (IQR) | 1.4% | 1.8% |
| Standard Deviation (Sample) | 1.5% | 1.1% |
| Standard Deviation (Population) | 1.5% | 1.1% |
Similar Demographics by Nursery School
Demographics Similar to Liberians by Nursery School
In terms of nursery school, the demographic groups most similar to Liberians are Immigrants from Indonesia (97.7%, a difference of 0.0%), Asian (97.6%, a difference of 0.0%), South American (97.6%, a difference of 0.010%), Bolivian (97.6%, a difference of 0.010%), and Peruvian (97.6%, a difference of 0.010%).
| Demographics | Rating | Rank | Nursery School |
| Immigrants | Pakistan | 2.1 /100 | #235 | Tragic 97.7% |
| Immigrants | Malaysia | 1.9 /100 | #236 | Tragic 97.7% |
| Immigrants | Western Asia | 1.9 /100 | #237 | Tragic 97.7% |
| Nigerians | 1.7 /100 | #238 | Tragic 97.7% |
| Immigrants | Eastern Asia | 1.6 /100 | #239 | Tragic 97.7% |
| Koreans | 1.4 /100 | #240 | Tragic 97.7% |
| Immigrants | Indonesia | 1.1 /100 | #241 | Tragic 97.7% |
| Liberians | 1.1 /100 | #242 | Tragic 97.7% |
| Asians | 1.1 /100 | #243 | Tragic 97.6% |
| South Americans | 1.0 /100 | #244 | Tragic 97.6% |
| Bolivians | 1.0 /100 | #245 | Tragic 97.6% |
| Peruvians | 1.0 /100 | #246 | Tragic 97.6% |
| Immigrants | Middle Africa | 0.9 /100 | #247 | Tragic 97.6% |
| Indians (Asian) | 0.9 /100 | #248 | Tragic 97.6% |
| Immigrants | Eastern Africa | 0.9 /100 | #249 | Tragic 97.6% |
Demographics Similar to Immigrants from Spain by Nursery School
In terms of nursery school, the demographic groups most similar to Immigrants from Spain are Ugandan (98.0%, a difference of 0.0%), Chilean (98.0%, a difference of 0.0%), Spanish American (98.0%, a difference of 0.0%), Immigrants from Micronesia (98.0%, a difference of 0.0%), and Immigrants from Russia (98.0%, a difference of 0.010%).
| Demographics | Rating | Rank | Nursery School |
| Immigrants | Russia | 59.9 /100 | #160 | Average 98.0% |
| Immigrants | Eastern Europe | 59.7 /100 | #161 | Average 98.0% |
| Brazilians | 59.4 /100 | #162 | Average 98.0% |
| Immigrants | Italy | 59.0 /100 | #163 | Average 98.0% |
| Ugandans | 56.4 /100 | #164 | Average 98.0% |
| Chileans | 56.4 /100 | #165 | Average 98.0% |
| Spanish Americans | 55.6 /100 | #166 | Average 98.0% |
| Immigrants | Spain | 55.6 /100 | #167 | Average 98.0% |
| Immigrants | Micronesia | 55.0 /100 | #168 | Average 98.0% |
| Immigrants | Korea | 53.8 /100 | #169 | Average 98.0% |
| Bermudans | 53.7 /100 | #170 | Average 98.0% |
| Immigrants | Jordan | 53.4 /100 | #171 | Average 98.0% |
| Immigrants | Brazil | 51.3 /100 | #172 | Average 98.0% |
| Kenyans | 50.2 /100 | #173 | Average 98.0% |
| Navajo | 50.0 /100 | #174 | Average 98.0% |