Immigrants from Ghana vs Iranian Associate's Degree
COMPARE
Immigrants from Ghana
Iranian
Associate's Degree
Associate's Degree Comparison
Immigrants from Ghana
Iranians
44.8%
ASSOCIATE'S DEGREE
14.2/ 100
METRIC RATING
213th/ 347
METRIC RANK
58.2%
ASSOCIATE'S DEGREE
100.0/ 100
METRIC RATING
5th/ 347
METRIC RANK
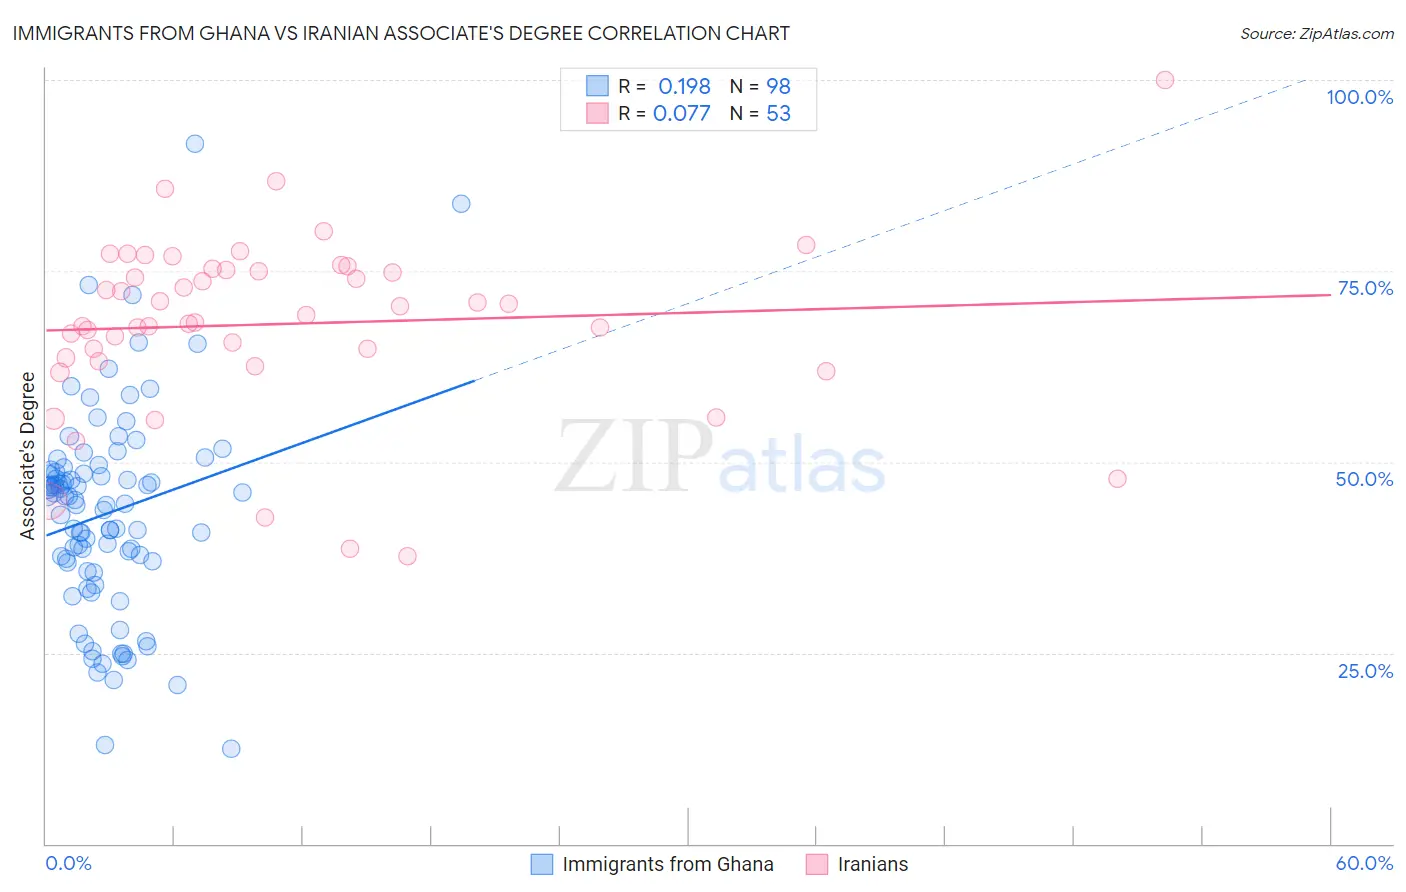
Immigrants from Ghana vs Iranian Associate's Degree Correlation Chart
The statistical analysis conducted on geographies consisting of 199,944,026 people shows a poor positive correlation between the proportion of Immigrants from Ghana and percentage of population with at least associate's degree education in the United States with a correlation coefficient (R) of 0.198 and weighted average of 44.8%. Similarly, the statistical analysis conducted on geographies consisting of 316,879,465 people shows a slight positive correlation between the proportion of Iranians and percentage of population with at least associate's degree education in the United States with a correlation coefficient (R) of 0.077 and weighted average of 58.2%, a difference of 29.8%.
Associate's Degree Correlation Summary
| Measurement | Immigrants from Ghana | Iranian |
| Minimum | 12.5% | 37.7% |
| Maximum | 91.7% | 100.0% |
| Range | 79.2% | 62.3% |
| Mean | 43.2% | 68.1% |
| Median | 44.8% | 69.2% |
| Interquartile 25% (IQ1) | 36.9% | 63.4% |
| Interquartile 75% (IQ3) | 48.6% | 75.2% |
| Interquartile Range (IQR) | 11.7% | 11.8% |
| Standard Deviation (Sample) | 13.5% | 11.7% |
| Standard Deviation (Population) | 13.4% | 11.6% |
Similar Demographics by Associate's Degree
Demographics Similar to Immigrants from Ghana by Associate's Degree
In terms of associate's degree, the demographic groups most similar to Immigrants from Ghana are French Canadian (44.9%, a difference of 0.12%), Immigrants from Middle Africa (44.7%, a difference of 0.25%), Immigrants from Panama (44.7%, a difference of 0.31%), Immigrants from Zaire (45.0%, a difference of 0.35%), and Immigrants from Philippines (45.0%, a difference of 0.36%).
| Demographics | Rating | Rank | Associate's Degree |
| German Russians | 18.9 /100 | #206 | Poor 45.1% |
| Panamanians | 18.4 /100 | #207 | Poor 45.1% |
| Dutch | 17.6 /100 | #208 | Poor 45.0% |
| Immigrants | Costa Rica | 16.7 /100 | #209 | Poor 45.0% |
| Immigrants | Philippines | 16.7 /100 | #210 | Poor 45.0% |
| Immigrants | Zaire | 16.6 /100 | #211 | Poor 45.0% |
| French Canadians | 15.0 /100 | #212 | Poor 44.9% |
| Immigrants | Ghana | 14.2 /100 | #213 | Poor 44.8% |
| Immigrants | Middle Africa | 12.7 /100 | #214 | Poor 44.7% |
| Immigrants | Panama | 12.4 /100 | #215 | Poor 44.7% |
| Immigrants | Nigeria | 11.4 /100 | #216 | Poor 44.6% |
| Immigrants | Immigrants | 10.5 /100 | #217 | Poor 44.5% |
| Spanish | 9.4 /100 | #218 | Tragic 44.4% |
| Whites/Caucasians | 7.5 /100 | #219 | Tragic 44.2% |
| Portuguese | 7.2 /100 | #220 | Tragic 44.1% |
Demographics Similar to Iranians by Associate's Degree
In terms of associate's degree, the demographic groups most similar to Iranians are Immigrants from Taiwan (58.4%, a difference of 0.41%), Immigrants from India (58.5%, a difference of 0.66%), Okinawan (57.7%, a difference of 0.83%), Immigrants from Iran (57.7%, a difference of 0.89%), and Thai (57.4%, a difference of 1.3%).
| Demographics | Rating | Rank | Associate's Degree |
| Filipinos | 100.0 /100 | #1 | Exceptional 59.8% |
| Immigrants | Singapore | 100.0 /100 | #2 | Exceptional 58.9% |
| Immigrants | India | 100.0 /100 | #3 | Exceptional 58.5% |
| Immigrants | Taiwan | 100.0 /100 | #4 | Exceptional 58.4% |
| Iranians | 100.0 /100 | #5 | Exceptional 58.2% |
| Okinawans | 100.0 /100 | #6 | Exceptional 57.7% |
| Immigrants | Iran | 100.0 /100 | #7 | Exceptional 57.7% |
| Thais | 100.0 /100 | #8 | Exceptional 57.4% |
| Immigrants | Israel | 100.0 /100 | #9 | Exceptional 56.8% |
| Cypriots | 100.0 /100 | #10 | Exceptional 56.4% |
| Immigrants | Australia | 100.0 /100 | #11 | Exceptional 55.8% |
| Immigrants | South Central Asia | 100.0 /100 | #12 | Exceptional 55.7% |
| Immigrants | China | 100.0 /100 | #13 | Exceptional 55.5% |
| Immigrants | Hong Kong | 100.0 /100 | #14 | Exceptional 55.4% |
| Immigrants | Eastern Asia | 100.0 /100 | #15 | Exceptional 55.4% |