Immigrants from Nepal vs Iranian Associate's Degree
COMPARE
Immigrants from Nepal
Iranian
Associate's Degree
Associate's Degree Comparison
Immigrants from Nepal
Iranians
49.5%
ASSOCIATE'S DEGREE
97.5/ 100
METRIC RATING
100th/ 347
METRIC RANK
58.2%
ASSOCIATE'S DEGREE
100.0/ 100
METRIC RATING
5th/ 347
METRIC RANK
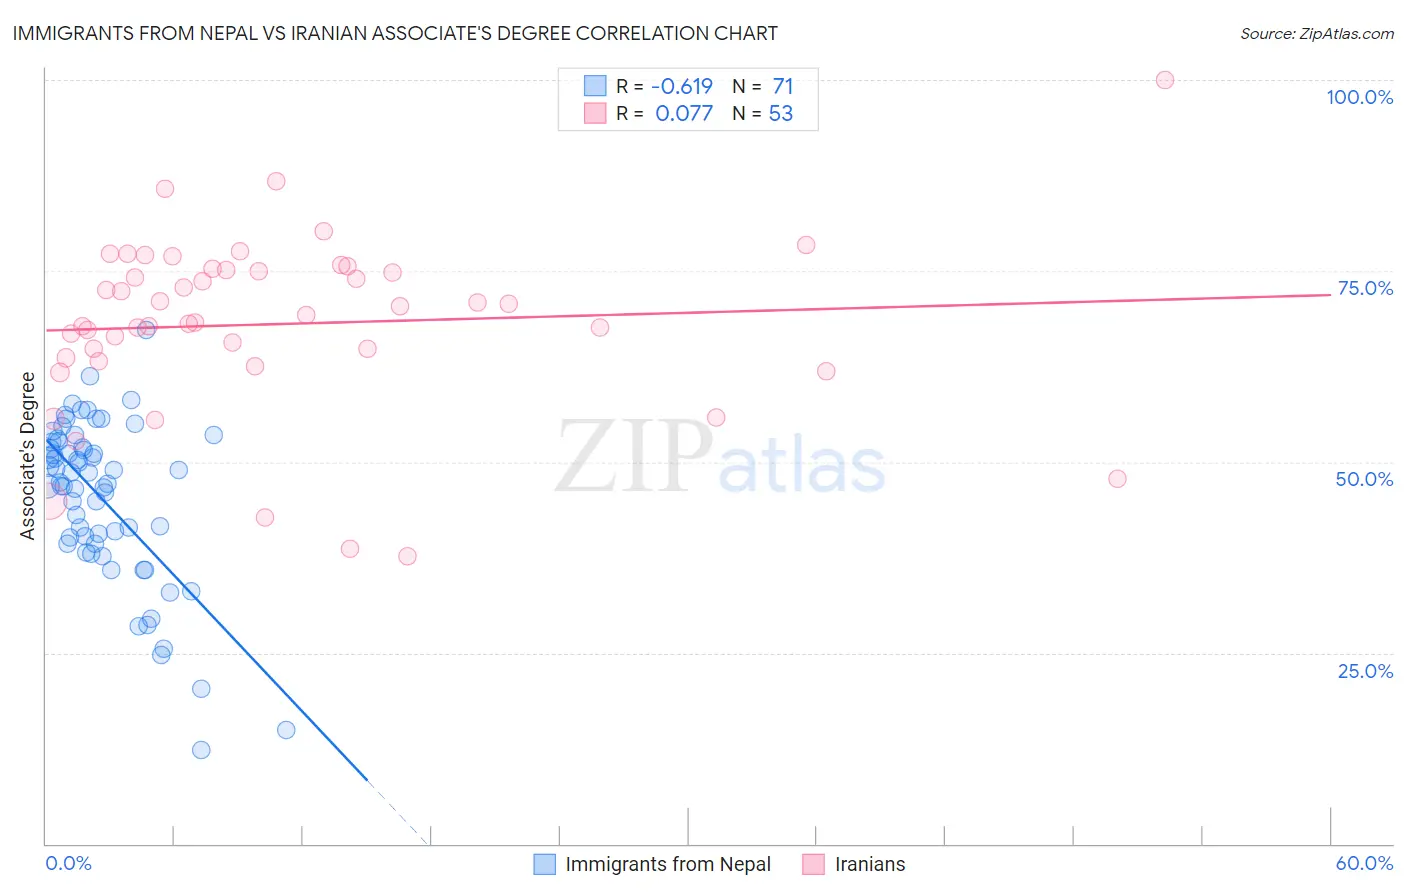
Immigrants from Nepal vs Iranian Associate's Degree Correlation Chart
The statistical analysis conducted on geographies consisting of 186,769,874 people shows a significant negative correlation between the proportion of Immigrants from Nepal and percentage of population with at least associate's degree education in the United States with a correlation coefficient (R) of -0.619 and weighted average of 49.5%. Similarly, the statistical analysis conducted on geographies consisting of 316,879,465 people shows a slight positive correlation between the proportion of Iranians and percentage of population with at least associate's degree education in the United States with a correlation coefficient (R) of 0.077 and weighted average of 58.2%, a difference of 17.4%.
Associate's Degree Correlation Summary
| Measurement | Immigrants from Nepal | Iranian |
| Minimum | 12.3% | 37.7% |
| Maximum | 67.3% | 100.0% |
| Range | 55.0% | 62.3% |
| Mean | 45.2% | 68.1% |
| Median | 47.3% | 69.2% |
| Interquartile 25% (IQ1) | 39.2% | 63.4% |
| Interquartile 75% (IQ3) | 52.6% | 75.2% |
| Interquartile Range (IQR) | 13.3% | 11.8% |
| Standard Deviation (Sample) | 10.7% | 11.7% |
| Standard Deviation (Population) | 10.6% | 11.6% |
Similar Demographics by Associate's Degree
Demographics Similar to Immigrants from Nepal by Associate's Degree
In terms of associate's degree, the demographic groups most similar to Immigrants from Nepal are Northern European (49.5%, a difference of 0.16%), Chilean (49.4%, a difference of 0.19%), Macedonian (49.6%, a difference of 0.22%), Immigrants from Northern Africa (49.7%, a difference of 0.28%), and Ukrainian (49.4%, a difference of 0.29%).
| Demographics | Rating | Rank | Associate's Degree |
| Immigrants | Brazil | 98.5 /100 | #93 | Exceptional 50.0% |
| Laotians | 98.4 /100 | #94 | Exceptional 49.9% |
| Immigrants | England | 98.0 /100 | #95 | Exceptional 49.7% |
| Romanians | 98.0 /100 | #96 | Exceptional 49.7% |
| Immigrants | Ukraine | 98.0 /100 | #97 | Exceptional 49.7% |
| Immigrants | Northern Africa | 97.9 /100 | #98 | Exceptional 49.7% |
| Macedonians | 97.8 /100 | #99 | Exceptional 49.6% |
| Immigrants | Nepal | 97.5 /100 | #100 | Exceptional 49.5% |
| Northern Europeans | 97.3 /100 | #101 | Exceptional 49.5% |
| Chileans | 97.3 /100 | #102 | Exceptional 49.4% |
| Ukrainians | 97.1 /100 | #103 | Exceptional 49.4% |
| Venezuelans | 97.0 /100 | #104 | Exceptional 49.4% |
| Croatians | 96.8 /100 | #105 | Exceptional 49.3% |
| Immigrants | Italy | 96.7 /100 | #106 | Exceptional 49.3% |
| Syrians | 96.7 /100 | #107 | Exceptional 49.3% |
Demographics Similar to Iranians by Associate's Degree
In terms of associate's degree, the demographic groups most similar to Iranians are Immigrants from Taiwan (58.4%, a difference of 0.41%), Immigrants from India (58.5%, a difference of 0.66%), Okinawan (57.7%, a difference of 0.83%), Immigrants from Iran (57.7%, a difference of 0.89%), and Thai (57.4%, a difference of 1.3%).
| Demographics | Rating | Rank | Associate's Degree |
| Filipinos | 100.0 /100 | #1 | Exceptional 59.8% |
| Immigrants | Singapore | 100.0 /100 | #2 | Exceptional 58.9% |
| Immigrants | India | 100.0 /100 | #3 | Exceptional 58.5% |
| Immigrants | Taiwan | 100.0 /100 | #4 | Exceptional 58.4% |
| Iranians | 100.0 /100 | #5 | Exceptional 58.2% |
| Okinawans | 100.0 /100 | #6 | Exceptional 57.7% |
| Immigrants | Iran | 100.0 /100 | #7 | Exceptional 57.7% |
| Thais | 100.0 /100 | #8 | Exceptional 57.4% |
| Immigrants | Israel | 100.0 /100 | #9 | Exceptional 56.8% |
| Cypriots | 100.0 /100 | #10 | Exceptional 56.4% |
| Immigrants | Australia | 100.0 /100 | #11 | Exceptional 55.8% |
| Immigrants | South Central Asia | 100.0 /100 | #12 | Exceptional 55.7% |
| Immigrants | China | 100.0 /100 | #13 | Exceptional 55.5% |
| Immigrants | Hong Kong | 100.0 /100 | #14 | Exceptional 55.4% |
| Immigrants | Eastern Asia | 100.0 /100 | #15 | Exceptional 55.4% |