South American Indian vs Crow College, Under 1 year
COMPARE
South American Indian
Crow
College, Under 1 year
College, Under 1 year Comparison
South American Indians
Crow
65.5%
COLLEGE, UNDER 1 YEAR
54.4/ 100
METRIC RATING
172nd/ 347
METRIC RANK
60.2%
COLLEGE, UNDER 1 YEAR
0.1/ 100
METRIC RATING
280th/ 347
METRIC RANK
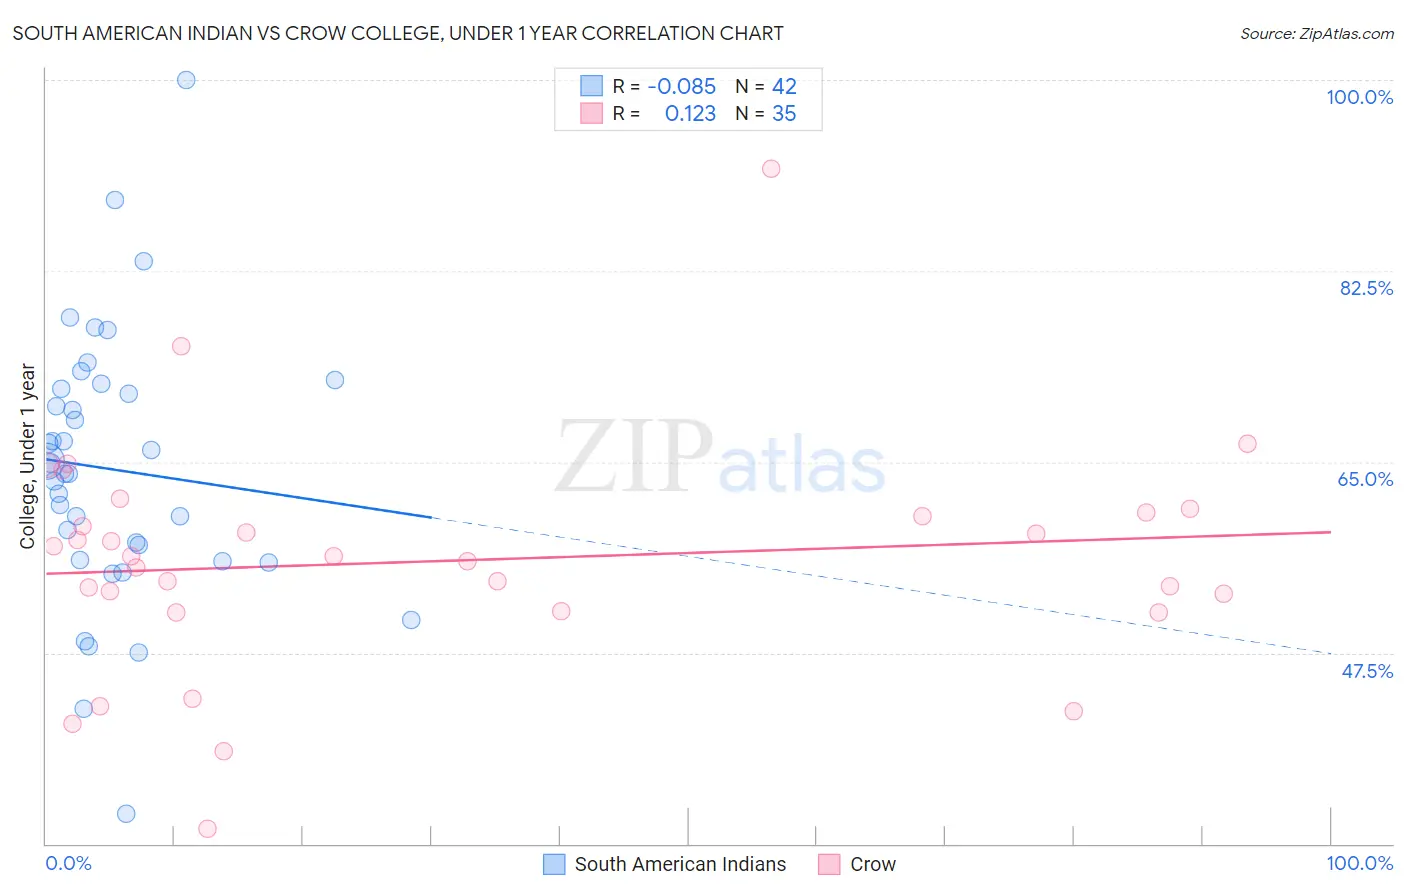
South American Indian vs Crow College, Under 1 year Correlation Chart
The statistical analysis conducted on geographies consisting of 164,573,280 people shows a slight negative correlation between the proportion of South American Indians and percentage of population with at least college, under 1 year education in the United States with a correlation coefficient (R) of -0.085 and weighted average of 65.5%. Similarly, the statistical analysis conducted on geographies consisting of 59,209,940 people shows a poor positive correlation between the proportion of Crow and percentage of population with at least college, under 1 year education in the United States with a correlation coefficient (R) of 0.123 and weighted average of 60.2%, a difference of 8.9%.
College, Under 1 year Correlation Summary
| Measurement | South American Indian | Crow |
| Minimum | 32.7% | 31.4% |
| Maximum | 100.0% | 91.8% |
| Range | 67.3% | 60.4% |
| Mean | 64.3% | 55.9% |
| Median | 64.4% | 56.3% |
| Interquartile 25% (IQ1) | 56.0% | 51.3% |
| Interquartile 75% (IQ3) | 71.7% | 60.3% |
| Interquartile Range (IQR) | 15.7% | 9.1% |
| Standard Deviation (Sample) | 12.4% | 10.7% |
| Standard Deviation (Population) | 12.3% | 10.6% |
Similar Demographics by College, Under 1 year
Demographics Similar to South American Indians by College, Under 1 year
In terms of college, under 1 year, the demographic groups most similar to South American Indians are Swiss (65.5%, a difference of 0.020%), Immigrants from Oceania (65.6%, a difference of 0.030%), Yugoslavian (65.6%, a difference of 0.060%), German (65.6%, a difference of 0.060%), and Hungarian (65.6%, a difference of 0.070%).
| Demographics | Rating | Rank | College, Under 1 year |
| Immigrants | Uzbekistan | 61.6 /100 | #165 | Good 65.8% |
| Moroccans | 56.7 /100 | #166 | Average 65.6% |
| Immigrants | Somalia | 56.4 /100 | #167 | Average 65.6% |
| Hungarians | 55.9 /100 | #168 | Average 65.6% |
| Yugoslavians | 55.7 /100 | #169 | Average 65.6% |
| Germans | 55.7 /100 | #170 | Average 65.6% |
| Immigrants | Oceania | 55.0 /100 | #171 | Average 65.6% |
| South American Indians | 54.4 /100 | #172 | Average 65.5% |
| Swiss | 53.9 /100 | #173 | Average 65.5% |
| Immigrants | Bosnia and Herzegovina | 50.0 /100 | #174 | Average 65.4% |
| Scotch-Irish | 49.5 /100 | #175 | Average 65.4% |
| French | 48.9 /100 | #176 | Average 65.4% |
| Immigrants | North Macedonia | 48.6 /100 | #177 | Average 65.4% |
| German Russians | 48.3 /100 | #178 | Average 65.4% |
| Guamanians/Chamorros | 48.2 /100 | #179 | Average 65.4% |
Demographics Similar to Crow by College, Under 1 year
In terms of college, under 1 year, the demographic groups most similar to Crow are Ute (60.2%, a difference of 0.090%), Yaqui (60.2%, a difference of 0.10%), Cherokee (60.1%, a difference of 0.11%), Bahamian (60.3%, a difference of 0.14%), and Belizean (60.1%, a difference of 0.16%).
| Demographics | Rating | Rank | College, Under 1 year |
| Chickasaw | 0.1 /100 | #273 | Tragic 60.4% |
| Alaska Natives | 0.1 /100 | #274 | Tragic 60.4% |
| Immigrants | Barbados | 0.1 /100 | #275 | Tragic 60.4% |
| Arapaho | 0.1 /100 | #276 | Tragic 60.3% |
| Bahamians | 0.1 /100 | #277 | Tragic 60.3% |
| Yaqui | 0.1 /100 | #278 | Tragic 60.2% |
| Ute | 0.1 /100 | #279 | Tragic 60.2% |
| Crow | 0.1 /100 | #280 | Tragic 60.2% |
| Cherokee | 0.1 /100 | #281 | Tragic 60.1% |
| Belizeans | 0.1 /100 | #282 | Tragic 60.1% |
| Immigrants | Jamaica | 0.0 /100 | #283 | Tragic 59.7% |
| Immigrants | St. Vincent and the Grenadines | 0.0 /100 | #284 | Tragic 59.6% |
| Paiute | 0.0 /100 | #285 | Tragic 59.6% |
| British West Indians | 0.0 /100 | #286 | Tragic 59.5% |
| Sioux | 0.0 /100 | #287 | Tragic 59.4% |