Pima vs Crow College, Under 1 year
COMPARE
Pima
Crow
College, Under 1 year
College, Under 1 year Comparison
Pima
Crow
51.4%
COLLEGE, UNDER 1 YEAR
0.0/ 100
METRIC RATING
345th/ 347
METRIC RANK
60.2%
COLLEGE, UNDER 1 YEAR
0.1/ 100
METRIC RATING
280th/ 347
METRIC RANK
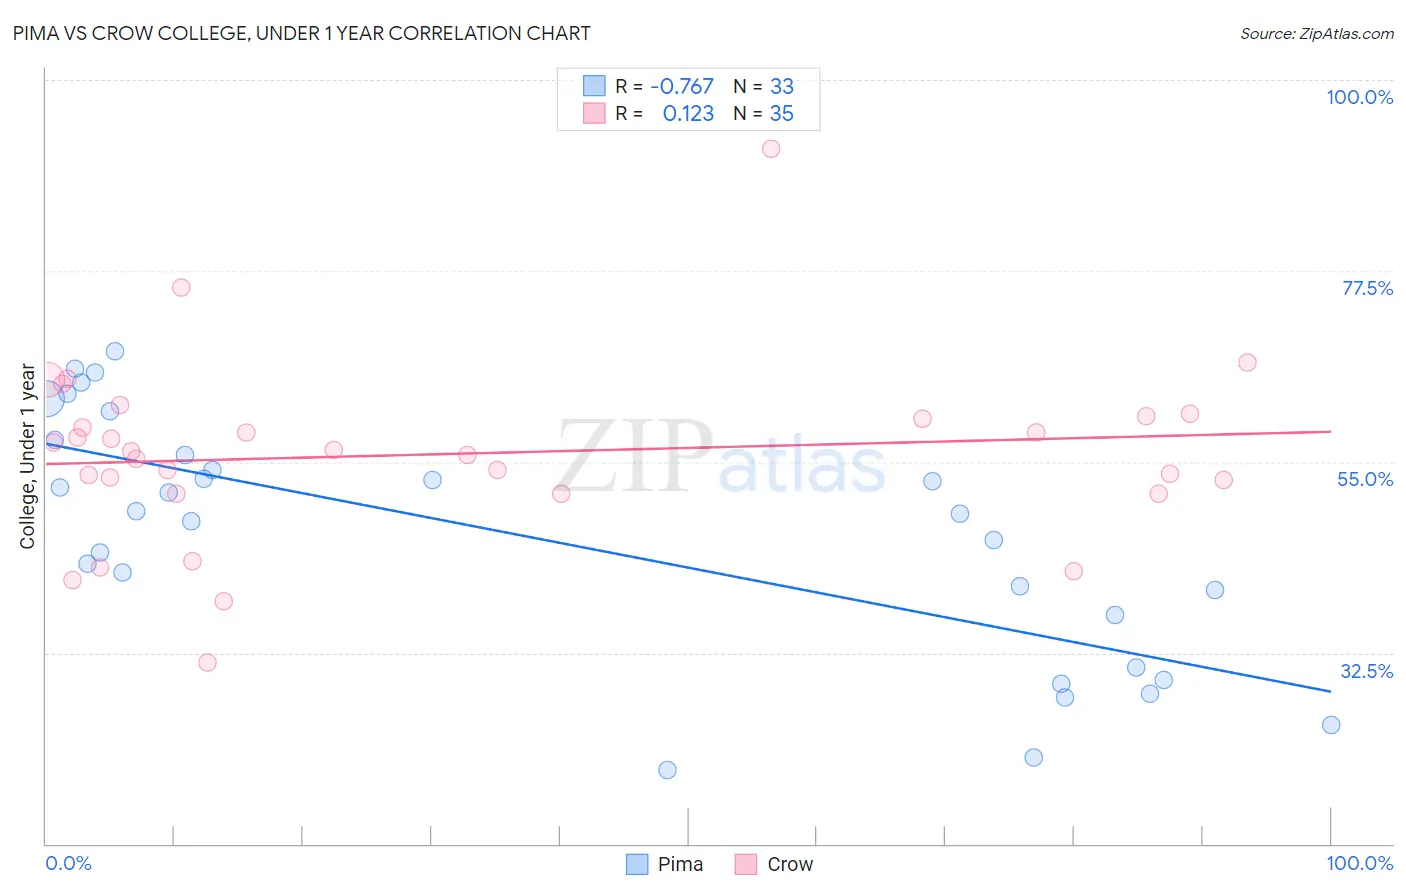
Pima vs Crow College, Under 1 year Correlation Chart
The statistical analysis conducted on geographies consisting of 61,552,513 people shows a strong negative correlation between the proportion of Pima and percentage of population with at least college, under 1 year education in the United States with a correlation coefficient (R) of -0.767 and weighted average of 51.4%. Similarly, the statistical analysis conducted on geographies consisting of 59,209,940 people shows a poor positive correlation between the proportion of Crow and percentage of population with at least college, under 1 year education in the United States with a correlation coefficient (R) of 0.123 and weighted average of 60.2%, a difference of 17.1%.
College, Under 1 year Correlation Summary
| Measurement | Pima | Crow |
| Minimum | 18.7% | 31.4% |
| Maximum | 68.0% | 91.8% |
| Range | 49.3% | 60.4% |
| Mean | 46.2% | 55.9% |
| Median | 48.9% | 56.3% |
| Interquartile 25% (IQ1) | 33.9% | 51.3% |
| Interquartile 75% (IQ3) | 56.7% | 60.3% |
| Interquartile Range (IQR) | 22.9% | 9.1% |
| Standard Deviation (Sample) | 14.2% | 10.7% |
| Standard Deviation (Population) | 14.0% | 10.6% |
Similar Demographics by College, Under 1 year
Demographics Similar to Pima by College, Under 1 year
In terms of college, under 1 year, the demographic groups most similar to Pima are Yakama (52.6%, a difference of 2.4%), Tohono O'odham (52.8%, a difference of 2.7%), Immigrants from Mexico (53.7%, a difference of 4.3%), Immigrants from Cabo Verde (53.7%, a difference of 4.4%), and Spanish American Indian (54.0%, a difference of 5.0%).
| Demographics | Rating | Rank | College, Under 1 year |
| Yuman | 0.0 /100 | #333 | Tragic 55.1% |
| Immigrants | Azores | 0.0 /100 | #334 | Tragic 54.7% |
| Inupiat | 0.0 /100 | #335 | Tragic 54.6% |
| Pennsylvania Germans | 0.0 /100 | #336 | Tragic 54.5% |
| Immigrants | Central America | 0.0 /100 | #337 | Tragic 54.4% |
| Lumbee | 0.0 /100 | #338 | Tragic 54.2% |
| Immigrants | Dominican Republic | 0.0 /100 | #339 | Tragic 54.0% |
| Spanish American Indians | 0.0 /100 | #340 | Tragic 54.0% |
| Immigrants | Cabo Verde | 0.0 /100 | #341 | Tragic 53.7% |
| Immigrants | Mexico | 0.0 /100 | #342 | Tragic 53.7% |
| Tohono O'odham | 0.0 /100 | #343 | Tragic 52.8% |
| Yakama | 0.0 /100 | #344 | Tragic 52.6% |
| Pima | 0.0 /100 | #345 | Tragic 51.4% |
| Houma | 0.0 /100 | #346 | Tragic 47.6% |
| Yup'ik | 0.0 /100 | #347 | Tragic 45.8% |
Demographics Similar to Crow by College, Under 1 year
In terms of college, under 1 year, the demographic groups most similar to Crow are Ute (60.2%, a difference of 0.090%), Yaqui (60.2%, a difference of 0.10%), Cherokee (60.1%, a difference of 0.11%), Bahamian (60.3%, a difference of 0.14%), and Belizean (60.1%, a difference of 0.16%).
| Demographics | Rating | Rank | College, Under 1 year |
| Chickasaw | 0.1 /100 | #273 | Tragic 60.4% |
| Alaska Natives | 0.1 /100 | #274 | Tragic 60.4% |
| Immigrants | Barbados | 0.1 /100 | #275 | Tragic 60.4% |
| Arapaho | 0.1 /100 | #276 | Tragic 60.3% |
| Bahamians | 0.1 /100 | #277 | Tragic 60.3% |
| Yaqui | 0.1 /100 | #278 | Tragic 60.2% |
| Ute | 0.1 /100 | #279 | Tragic 60.2% |
| Crow | 0.1 /100 | #280 | Tragic 60.2% |
| Cherokee | 0.1 /100 | #281 | Tragic 60.1% |
| Belizeans | 0.1 /100 | #282 | Tragic 60.1% |
| Immigrants | Jamaica | 0.0 /100 | #283 | Tragic 59.7% |
| Immigrants | St. Vincent and the Grenadines | 0.0 /100 | #284 | Tragic 59.6% |
| Paiute | 0.0 /100 | #285 | Tragic 59.6% |
| British West Indians | 0.0 /100 | #286 | Tragic 59.5% |
| Sioux | 0.0 /100 | #287 | Tragic 59.4% |