Lebanese vs Dutch West Indian Professional Degree
COMPARE
Lebanese
Dutch West Indian
Professional Degree
Professional Degree Comparison
Lebanese
Dutch West Indians
5.0%
PROFESSIONAL DEGREE
98.0/ 100
METRIC RATING
110th/ 347
METRIC RANK
3.1%
PROFESSIONAL DEGREE
0.0/ 100
METRIC RATING
327th/ 347
METRIC RANK
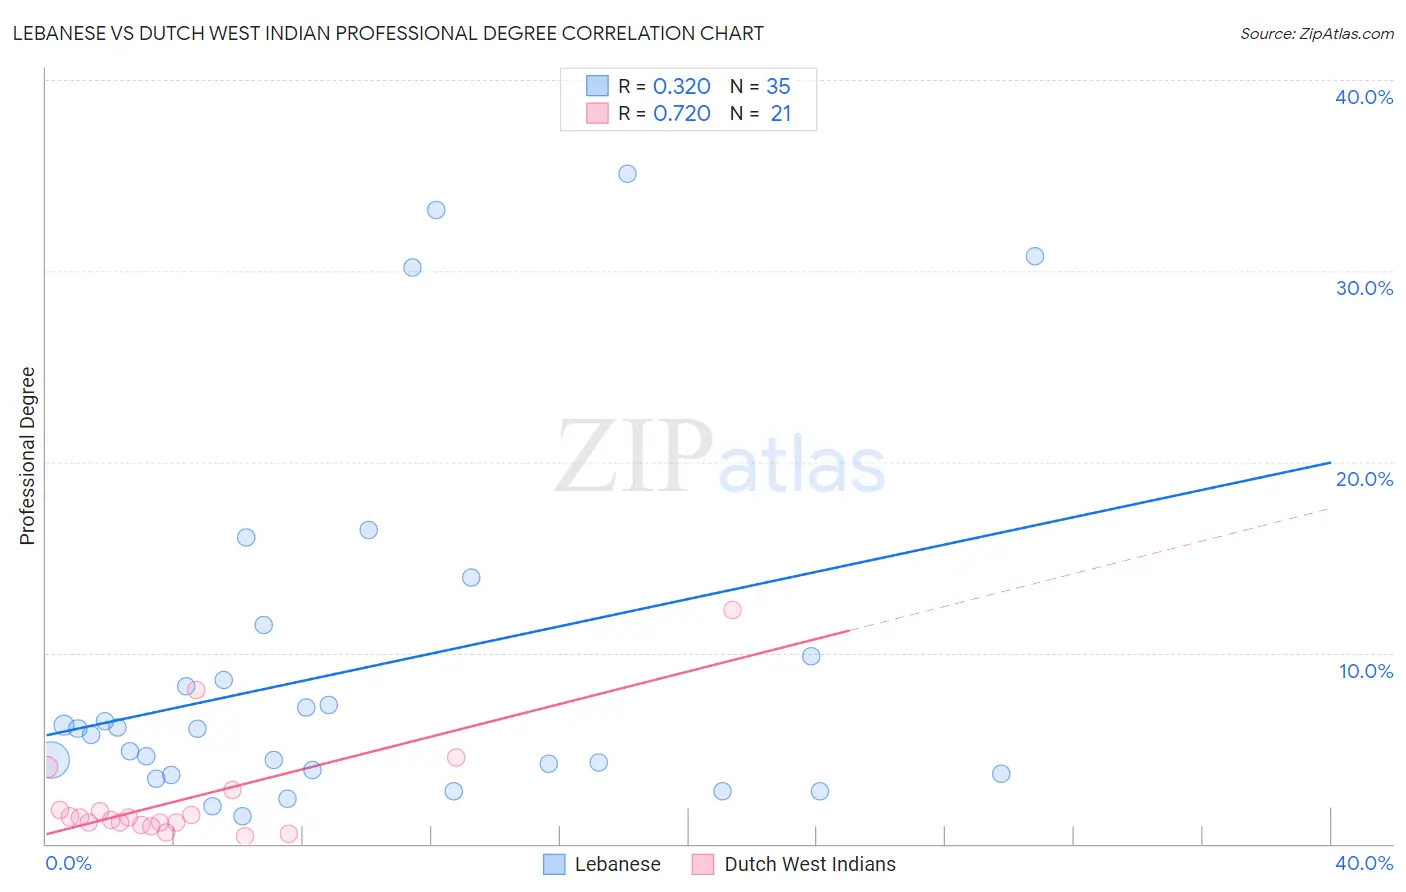
Lebanese vs Dutch West Indian Professional Degree Correlation Chart
The statistical analysis conducted on geographies consisting of 400,751,015 people shows a mild positive correlation between the proportion of Lebanese and percentage of population with at least professional degree education in the United States with a correlation coefficient (R) of 0.320 and weighted average of 5.0%. Similarly, the statistical analysis conducted on geographies consisting of 85,349,686 people shows a strong positive correlation between the proportion of Dutch West Indians and percentage of population with at least professional degree education in the United States with a correlation coefficient (R) of 0.720 and weighted average of 3.1%, a difference of 62.3%.
Professional Degree Correlation Summary
| Measurement | Lebanese | Dutch West Indian |
| Minimum | 1.4% | 0.42% |
| Maximum | 35.1% | 12.2% |
| Range | 33.7% | 11.8% |
| Mean | 9.1% | 2.4% |
| Median | 6.0% | 1.4% |
| Interquartile 25% (IQ1) | 3.6% | 1.0% |
| Interquartile 75% (IQ3) | 9.8% | 2.3% |
| Interquartile Range (IQR) | 6.2% | 1.3% |
| Standard Deviation (Sample) | 9.2% | 2.9% |
| Standard Deviation (Population) | 9.1% | 2.8% |
Similar Demographics by Professional Degree
Demographics Similar to Lebanese by Professional Degree
In terms of professional degree, the demographic groups most similar to Lebanese are British (5.0%, a difference of 0.15%), Immigrants from Southern Europe (5.0%, a difference of 0.16%), Maltese (5.0%, a difference of 0.20%), Immigrants from Ukraine (5.0%, a difference of 0.32%), and Immigrants from Uganda (5.0%, a difference of 0.35%).
| Demographics | Rating | Rank | Professional Degree |
| Immigrants | Northern Africa | 98.4 /100 | #103 | Exceptional 5.1% |
| Arabs | 98.2 /100 | #104 | Exceptional 5.0% |
| Immigrants | Uganda | 98.2 /100 | #105 | Exceptional 5.0% |
| Immigrants | Ukraine | 98.2 /100 | #106 | Exceptional 5.0% |
| Maltese | 98.1 /100 | #107 | Exceptional 5.0% |
| Immigrants | Southern Europe | 98.1 /100 | #108 | Exceptional 5.0% |
| British | 98.0 /100 | #109 | Exceptional 5.0% |
| Lebanese | 98.0 /100 | #110 | Exceptional 5.0% |
| Brazilians | 97.4 /100 | #111 | Exceptional 5.0% |
| Taiwanese | 97.3 /100 | #112 | Exceptional 5.0% |
| Immigrants | Pakistan | 97.2 /100 | #113 | Exceptional 5.0% |
| Immigrants | Morocco | 96.8 /100 | #114 | Exceptional 5.0% |
| Moroccans | 96.8 /100 | #115 | Exceptional 5.0% |
| Venezuelans | 96.3 /100 | #116 | Exceptional 4.9% |
| Immigrants | Syria | 96.0 /100 | #117 | Exceptional 4.9% |
Demographics Similar to Dutch West Indians by Professional Degree
In terms of professional degree, the demographic groups most similar to Dutch West Indians are Creek (3.1%, a difference of 0.060%), Menominee (3.1%, a difference of 0.10%), Bangladeshi (3.1%, a difference of 0.27%), Immigrants from Cabo Verde (3.1%, a difference of 0.35%), and Kiowa (3.1%, a difference of 0.47%).
| Demographics | Rating | Rank | Professional Degree |
| Seminole | 0.1 /100 | #320 | Tragic 3.2% |
| Tsimshian | 0.0 /100 | #321 | Tragic 3.2% |
| Hispanics or Latinos | 0.0 /100 | #322 | Tragic 3.2% |
| Inupiat | 0.0 /100 | #323 | Tragic 3.2% |
| Crow | 0.0 /100 | #324 | Tragic 3.2% |
| Yaqui | 0.0 /100 | #325 | Tragic 3.2% |
| Menominee | 0.0 /100 | #326 | Tragic 3.1% |
| Dutch West Indians | 0.0 /100 | #327 | Tragic 3.1% |
| Creek | 0.0 /100 | #328 | Tragic 3.1% |
| Bangladeshis | 0.0 /100 | #329 | Tragic 3.1% |
| Immigrants | Cabo Verde | 0.0 /100 | #330 | Tragic 3.1% |
| Kiowa | 0.0 /100 | #331 | Tragic 3.1% |
| Yakama | 0.0 /100 | #332 | Tragic 3.1% |
| Puget Sound Salish | 0.0 /100 | #333 | Tragic 3.1% |
| Pennsylvania Germans | 0.0 /100 | #334 | Tragic 3.0% |