Lebanese vs Immigrants from Zaire No Schooling Completed
COMPARE
Lebanese
Immigrants from Zaire
No Schooling Completed
No Schooling Completed Comparison
Lebanese
Immigrants from Zaire
1.9%
NO SCHOOLING COMPLETED
96.0/ 100
METRIC RATING
116th/ 347
METRIC RANK
2.3%
NO SCHOOLING COMPLETED
7.2/ 100
METRIC RATING
215th/ 347
METRIC RANK
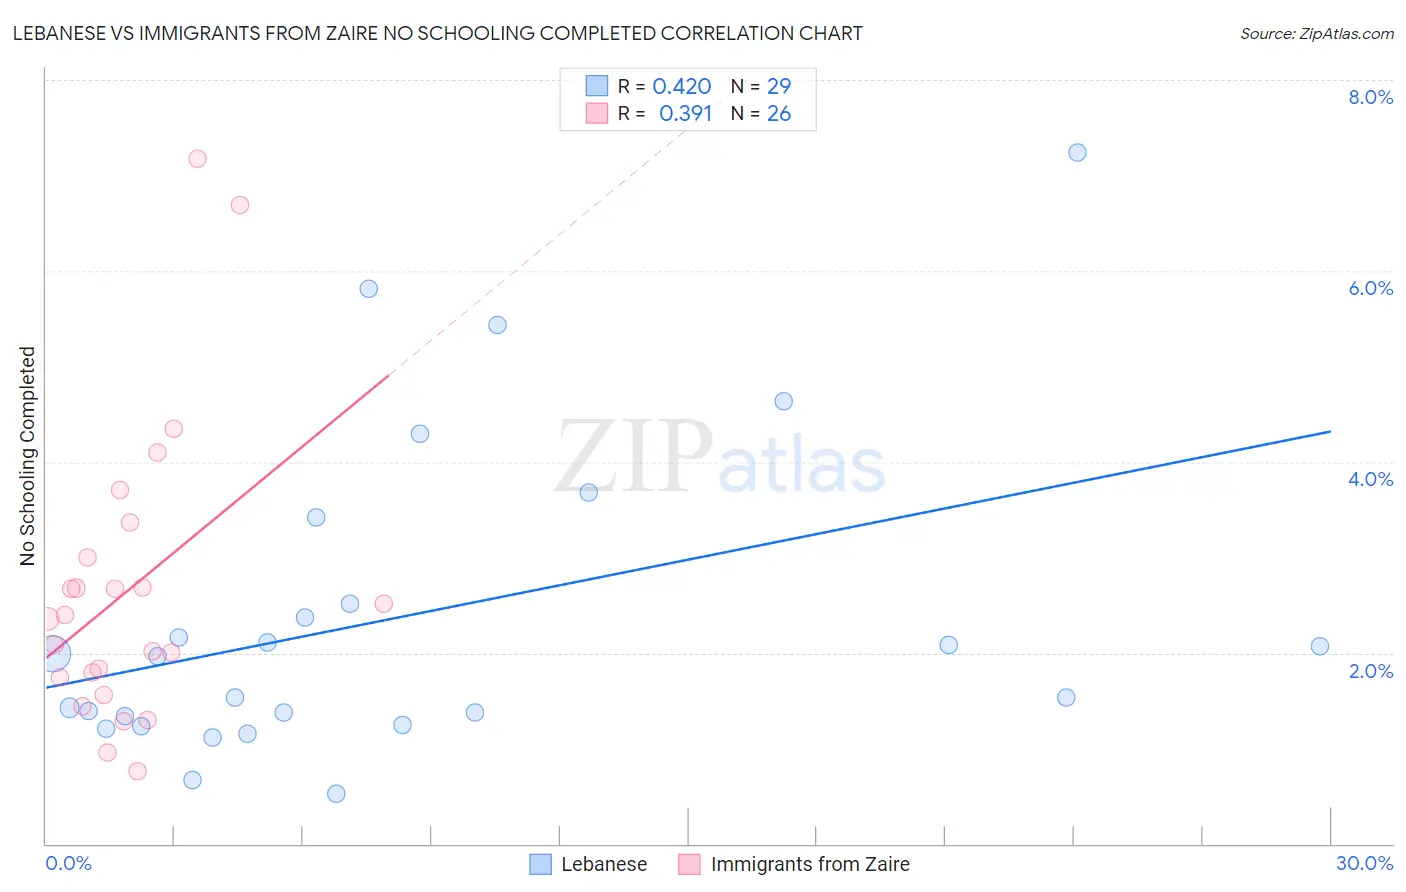
Lebanese vs Immigrants from Zaire No Schooling Completed Correlation Chart
The statistical analysis conducted on geographies consisting of 396,753,431 people shows a moderate positive correlation between the proportion of Lebanese and percentage of population with no schooling in the United States with a correlation coefficient (R) of 0.420 and weighted average of 1.9%. Similarly, the statistical analysis conducted on geographies consisting of 107,090,561 people shows a mild positive correlation between the proportion of Immigrants from Zaire and percentage of population with no schooling in the United States with a correlation coefficient (R) of 0.391 and weighted average of 2.3%, a difference of 21.6%.
No Schooling Completed Correlation Summary
| Measurement | Lebanese | Immigrants from Zaire |
| Minimum | 0.52% | 0.76% |
| Maximum | 7.2% | 7.2% |
| Range | 6.7% | 6.4% |
| Mean | 2.4% | 2.7% |
| Median | 2.0% | 2.4% |
| Interquartile 25% (IQ1) | 1.3% | 1.7% |
| Interquartile 75% (IQ3) | 3.0% | 3.0% |
| Interquartile Range (IQR) | 1.7% | 1.3% |
| Standard Deviation (Sample) | 1.7% | 1.5% |
| Standard Deviation (Population) | 1.6% | 1.5% |
Similar Demographics by No Schooling Completed
Demographics Similar to Lebanese by No Schooling Completed
In terms of no schooling completed, the demographic groups most similar to Lebanese are Syrian (1.9%, a difference of 0.020%), Immigrants from Norway (1.9%, a difference of 0.15%), Immigrants from Zimbabwe (1.9%, a difference of 0.16%), Immigrants from Serbia (1.9%, a difference of 0.20%), and Pueblo (1.9%, a difference of 0.41%).
| Demographics | Rating | Rank | No Schooling Completed |
| Immigrants | Saudi Arabia | 96.8 /100 | #109 | Exceptional 1.9% |
| Immigrants | Latvia | 96.7 /100 | #110 | Exceptional 1.9% |
| Immigrants | Japan | 96.6 /100 | #111 | Exceptional 1.9% |
| Pueblo | 96.4 /100 | #112 | Exceptional 1.9% |
| Immigrants | Zimbabwe | 96.2 /100 | #113 | Exceptional 1.9% |
| Immigrants | Norway | 96.1 /100 | #114 | Exceptional 1.9% |
| Syrians | 96.0 /100 | #115 | Exceptional 1.9% |
| Lebanese | 96.0 /100 | #116 | Exceptional 1.9% |
| Immigrants | Serbia | 95.8 /100 | #117 | Exceptional 1.9% |
| Spanish | 95.5 /100 | #118 | Exceptional 1.9% |
| Iroquois | 95.1 /100 | #119 | Exceptional 1.9% |
| Immigrants | Bulgaria | 94.6 /100 | #120 | Exceptional 1.9% |
| Immigrants | Croatia | 94.5 /100 | #121 | Exceptional 1.9% |
| Cree | 94.5 /100 | #122 | Exceptional 1.9% |
| Immigrants | Kuwait | 93.9 /100 | #123 | Exceptional 1.9% |
Demographics Similar to Immigrants from Zaire by No Schooling Completed
In terms of no schooling completed, the demographic groups most similar to Immigrants from Zaire are Tongan (2.3%, a difference of 0.20%), Immigrants from Syria (2.3%, a difference of 0.28%), Immigrants from Nepal (2.3%, a difference of 0.39%), Samoan (2.3%, a difference of 0.43%), and Ute (2.3%, a difference of 0.47%).
| Demographics | Rating | Rank | No Schooling Completed |
| Uruguayans | 11.0 /100 | #208 | Poor 2.2% |
| Immigrants | Oceania | 10.2 /100 | #209 | Poor 2.2% |
| Natives/Alaskans | 10.0 /100 | #210 | Tragic 2.2% |
| Immigrants | Panama | 8.8 /100 | #211 | Tragic 2.3% |
| Immigrants | Morocco | 8.7 /100 | #212 | Tragic 2.3% |
| Ute | 8.2 /100 | #213 | Tragic 2.3% |
| Samoans | 8.2 /100 | #214 | Tragic 2.3% |
| Immigrants | Zaire | 7.2 /100 | #215 | Tragic 2.3% |
| Tongans | 6.8 /100 | #216 | Tragic 2.3% |
| Immigrants | Syria | 6.6 /100 | #217 | Tragic 2.3% |
| Immigrants | Nepal | 6.4 /100 | #218 | Tragic 2.3% |
| Senegalese | 5.6 /100 | #219 | Tragic 2.3% |
| Immigrants | Costa Rica | 5.1 /100 | #220 | Tragic 2.3% |
| Immigrants | Sudan | 5.0 /100 | #221 | Tragic 2.3% |
| Sub-Saharan Africans | 4.7 /100 | #222 | Tragic 2.3% |