Lebanese vs Immigrants from Fiji Professional Degree
COMPARE
Lebanese
Immigrants from Fiji
Professional Degree
Professional Degree Comparison
Lebanese
Immigrants from Fiji
5.0%
PROFESSIONAL DEGREE
98.0/ 100
METRIC RATING
110th/ 347
METRIC RANK
3.7%
PROFESSIONAL DEGREE
1.5/ 100
METRIC RATING
250th/ 347
METRIC RANK
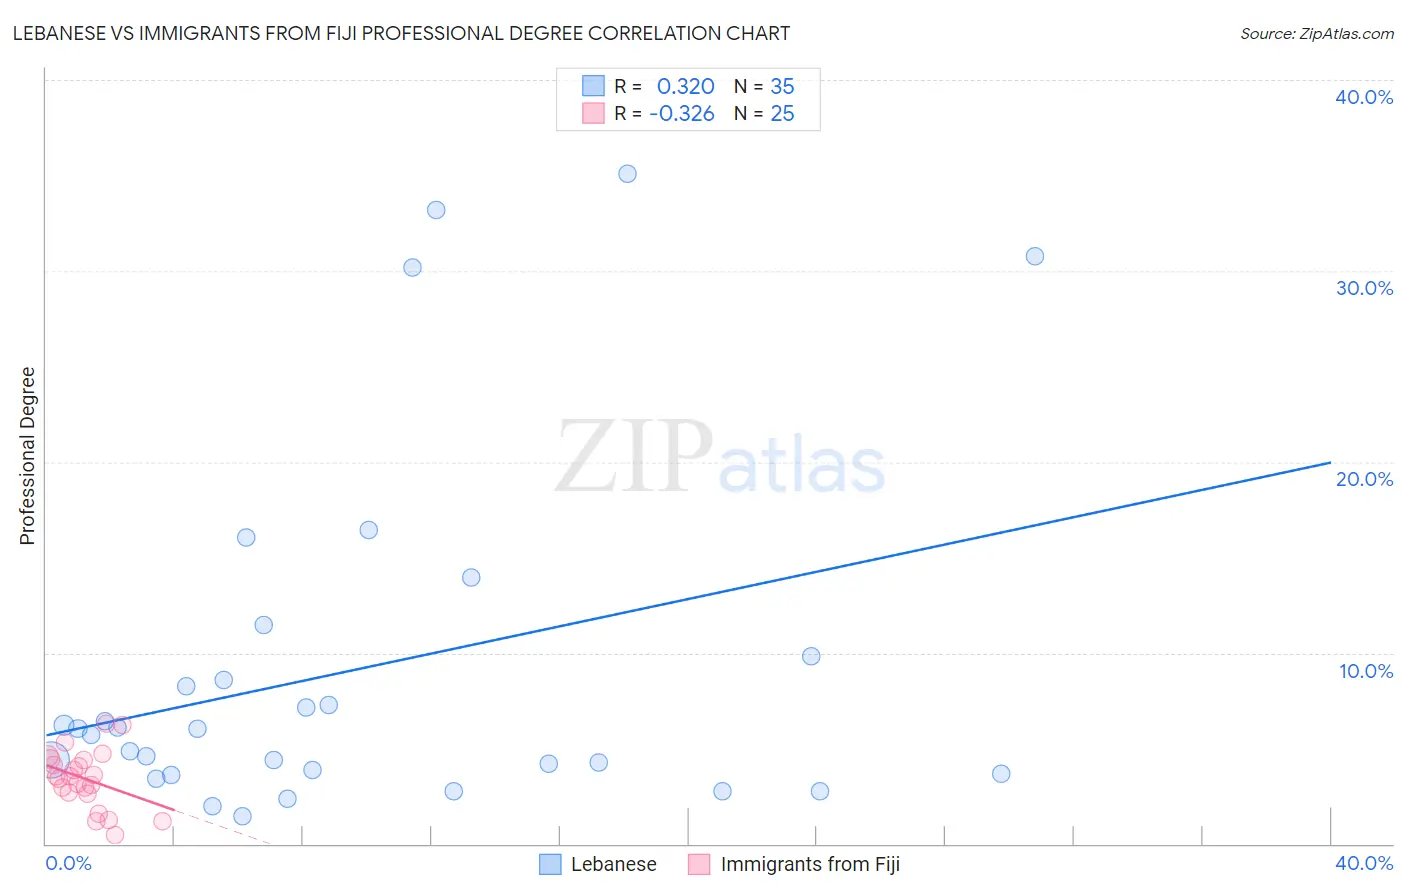
Lebanese vs Immigrants from Fiji Professional Degree Correlation Chart
The statistical analysis conducted on geographies consisting of 400,751,015 people shows a mild positive correlation between the proportion of Lebanese and percentage of population with at least professional degree education in the United States with a correlation coefficient (R) of 0.320 and weighted average of 5.0%. Similarly, the statistical analysis conducted on geographies consisting of 93,709,479 people shows a mild negative correlation between the proportion of Immigrants from Fiji and percentage of population with at least professional degree education in the United States with a correlation coefficient (R) of -0.326 and weighted average of 3.7%, a difference of 34.4%.
Professional Degree Correlation Summary
| Measurement | Lebanese | Immigrants from Fiji |
| Minimum | 1.4% | 0.47% |
| Maximum | 35.1% | 6.3% |
| Range | 33.7% | 5.8% |
| Mean | 9.1% | 3.4% |
| Median | 6.0% | 3.5% |
| Interquartile 25% (IQ1) | 3.6% | 2.7% |
| Interquartile 75% (IQ3) | 9.8% | 4.4% |
| Interquartile Range (IQR) | 6.2% | 1.7% |
| Standard Deviation (Sample) | 9.2% | 1.5% |
| Standard Deviation (Population) | 9.1% | 1.5% |
Similar Demographics by Professional Degree
Demographics Similar to Lebanese by Professional Degree
In terms of professional degree, the demographic groups most similar to Lebanese are British (5.0%, a difference of 0.15%), Immigrants from Southern Europe (5.0%, a difference of 0.16%), Maltese (5.0%, a difference of 0.20%), Immigrants from Ukraine (5.0%, a difference of 0.32%), and Immigrants from Uganda (5.0%, a difference of 0.35%).
| Demographics | Rating | Rank | Professional Degree |
| Immigrants | Northern Africa | 98.4 /100 | #103 | Exceptional 5.1% |
| Arabs | 98.2 /100 | #104 | Exceptional 5.0% |
| Immigrants | Uganda | 98.2 /100 | #105 | Exceptional 5.0% |
| Immigrants | Ukraine | 98.2 /100 | #106 | Exceptional 5.0% |
| Maltese | 98.1 /100 | #107 | Exceptional 5.0% |
| Immigrants | Southern Europe | 98.1 /100 | #108 | Exceptional 5.0% |
| British | 98.0 /100 | #109 | Exceptional 5.0% |
| Lebanese | 98.0 /100 | #110 | Exceptional 5.0% |
| Brazilians | 97.4 /100 | #111 | Exceptional 5.0% |
| Taiwanese | 97.3 /100 | #112 | Exceptional 5.0% |
| Immigrants | Pakistan | 97.2 /100 | #113 | Exceptional 5.0% |
| Immigrants | Morocco | 96.8 /100 | #114 | Exceptional 5.0% |
| Moroccans | 96.8 /100 | #115 | Exceptional 5.0% |
| Venezuelans | 96.3 /100 | #116 | Exceptional 4.9% |
| Immigrants | Syria | 96.0 /100 | #117 | Exceptional 4.9% |
Demographics Similar to Immigrants from Fiji by Professional Degree
In terms of professional degree, the demographic groups most similar to Immigrants from Fiji are Immigrants from Grenada (3.7%, a difference of 0.060%), Hmong (3.7%, a difference of 0.18%), Immigrants from Nicaragua (3.7%, a difference of 0.25%), Guyanese (3.8%, a difference of 0.34%), and Marshallese (3.8%, a difference of 0.36%).
| Demographics | Rating | Rank | Professional Degree |
| Guamanians/Chamorros | 2.2 /100 | #243 | Tragic 3.8% |
| Immigrants | Bahamas | 2.0 /100 | #244 | Tragic 3.8% |
| French American Indians | 1.7 /100 | #245 | Tragic 3.8% |
| Marshallese | 1.7 /100 | #246 | Tragic 3.8% |
| Guyanese | 1.6 /100 | #247 | Tragic 3.8% |
| Hmong | 1.6 /100 | #248 | Tragic 3.7% |
| Immigrants | Grenada | 1.5 /100 | #249 | Tragic 3.7% |
| Immigrants | Fiji | 1.5 /100 | #250 | Tragic 3.7% |
| Immigrants | Nicaragua | 1.4 /100 | #251 | Tragic 3.7% |
| Jamaicans | 1.4 /100 | #252 | Tragic 3.7% |
| Pueblo | 1.4 /100 | #253 | Tragic 3.7% |
| Tongans | 1.3 /100 | #254 | Tragic 3.7% |
| Osage | 1.2 /100 | #255 | Tragic 3.7% |
| Iroquois | 1.2 /100 | #256 | Tragic 3.7% |
| Bahamians | 1.1 /100 | #257 | Tragic 3.7% |