Lebanese vs Immigrants from Eastern Europe Professional Degree
COMPARE
Lebanese
Immigrants from Eastern Europe
Professional Degree
Professional Degree Comparison
Lebanese
Immigrants from Eastern Europe
5.0%
PROFESSIONAL DEGREE
98.0/ 100
METRIC RATING
110th/ 347
METRIC RANK
5.2%
PROFESSIONAL DEGREE
99.5/ 100
METRIC RATING
92nd/ 347
METRIC RANK
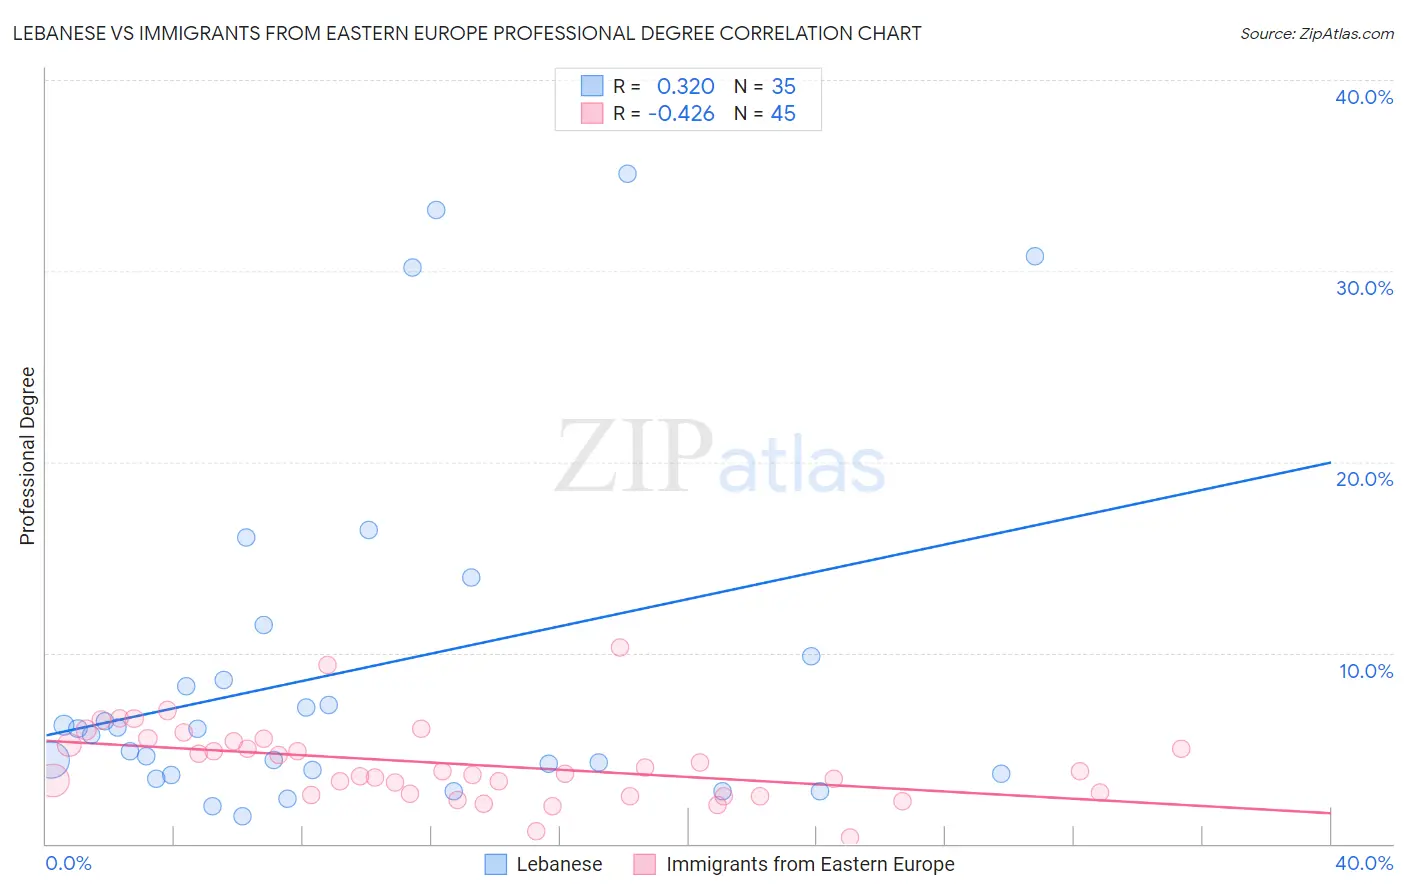
Lebanese vs Immigrants from Eastern Europe Professional Degree Correlation Chart
The statistical analysis conducted on geographies consisting of 400,751,015 people shows a mild positive correlation between the proportion of Lebanese and percentage of population with at least professional degree education in the United States with a correlation coefficient (R) of 0.320 and weighted average of 5.0%. Similarly, the statistical analysis conducted on geographies consisting of 474,383,803 people shows a moderate negative correlation between the proportion of Immigrants from Eastern Europe and percentage of population with at least professional degree education in the United States with a correlation coefficient (R) of -0.426 and weighted average of 5.2%, a difference of 4.3%.
Professional Degree Correlation Summary
| Measurement | Lebanese | Immigrants from Eastern Europe |
| Minimum | 1.4% | 0.35% |
| Maximum | 35.1% | 10.3% |
| Range | 33.7% | 9.9% |
| Mean | 9.1% | 4.2% |
| Median | 6.0% | 3.8% |
| Interquartile 25% (IQ1) | 3.6% | 2.6% |
| Interquartile 75% (IQ3) | 9.8% | 5.4% |
| Interquartile Range (IQR) | 6.2% | 2.8% |
| Standard Deviation (Sample) | 9.2% | 2.0% |
| Standard Deviation (Population) | 9.1% | 2.0% |
Demographics Similar to Lebanese and Immigrants from Eastern Europe by Professional Degree
In terms of professional degree, the demographic groups most similar to Lebanese are British (5.0%, a difference of 0.15%), Immigrants from Southern Europe (5.0%, a difference of 0.16%), Maltese (5.0%, a difference of 0.20%), Immigrants from Ukraine (5.0%, a difference of 0.32%), and Immigrants from Uganda (5.0%, a difference of 0.35%). Similarly, the demographic groups most similar to Immigrants from Eastern Europe are Laotian (5.2%, a difference of 0.040%), Northern European (5.2%, a difference of 0.65%), Alsatian (5.2%, a difference of 0.66%), Zimbabwean (5.2%, a difference of 0.85%), and Immigrants from Uzbekistan (5.2%, a difference of 1.3%).
| Demographics | Rating | Rank | Professional Degree |
| Laotians | 99.5 /100 | #91 | Exceptional 5.2% |
| Immigrants | Eastern Europe | 99.5 /100 | #92 | Exceptional 5.2% |
| Northern Europeans | 99.3 /100 | #93 | Exceptional 5.2% |
| Alsatians | 99.3 /100 | #94 | Exceptional 5.2% |
| Zimbabweans | 99.3 /100 | #95 | Exceptional 5.2% |
| Immigrants | Uzbekistan | 99.2 /100 | #96 | Exceptional 5.2% |
| Syrians | 99.1 /100 | #97 | Exceptional 5.2% |
| Austrians | 99.1 /100 | #98 | Exceptional 5.2% |
| Immigrants | Italy | 99.1 /100 | #99 | Exceptional 5.2% |
| Ugandans | 98.8 /100 | #100 | Exceptional 5.1% |
| Immigrants | Egypt | 98.5 /100 | #101 | Exceptional 5.1% |
| Ukrainians | 98.5 /100 | #102 | Exceptional 5.1% |
| Immigrants | Northern Africa | 98.4 /100 | #103 | Exceptional 5.1% |
| Arabs | 98.2 /100 | #104 | Exceptional 5.0% |
| Immigrants | Uganda | 98.2 /100 | #105 | Exceptional 5.0% |
| Immigrants | Ukraine | 98.2 /100 | #106 | Exceptional 5.0% |
| Maltese | 98.1 /100 | #107 | Exceptional 5.0% |
| Immigrants | Southern Europe | 98.1 /100 | #108 | Exceptional 5.0% |
| British | 98.0 /100 | #109 | Exceptional 5.0% |
| Lebanese | 98.0 /100 | #110 | Exceptional 5.0% |
| Brazilians | 97.4 /100 | #111 | Exceptional 5.0% |