Lebanese vs Immigrants from Somalia Professional Degree
COMPARE
Lebanese
Immigrants from Somalia
Professional Degree
Professional Degree Comparison
Lebanese
Immigrants from Somalia
5.0%
PROFESSIONAL DEGREE
98.0/ 100
METRIC RATING
110th/ 347
METRIC RANK
4.1%
PROFESSIONAL DEGREE
12.5/ 100
METRIC RATING
208th/ 347
METRIC RANK
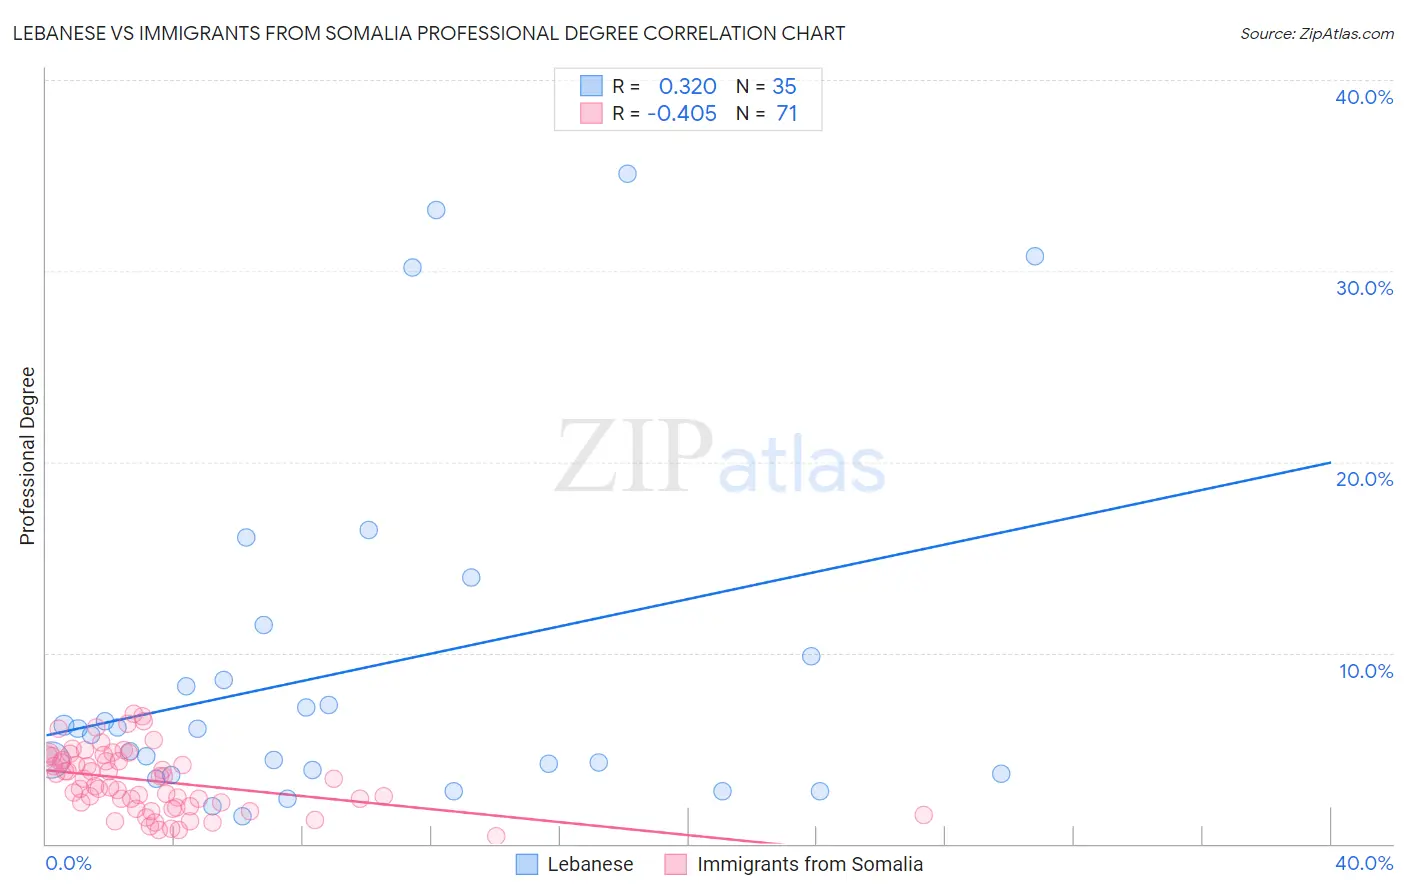
Lebanese vs Immigrants from Somalia Professional Degree Correlation Chart
The statistical analysis conducted on geographies consisting of 400,751,015 people shows a mild positive correlation between the proportion of Lebanese and percentage of population with at least professional degree education in the United States with a correlation coefficient (R) of 0.320 and weighted average of 5.0%. Similarly, the statistical analysis conducted on geographies consisting of 92,074,778 people shows a moderate negative correlation between the proportion of Immigrants from Somalia and percentage of population with at least professional degree education in the United States with a correlation coefficient (R) of -0.405 and weighted average of 4.1%, a difference of 22.7%.
Professional Degree Correlation Summary
| Measurement | Lebanese | Immigrants from Somalia |
| Minimum | 1.4% | 0.40% |
| Maximum | 35.1% | 6.8% |
| Range | 33.7% | 6.4% |
| Mean | 9.1% | 3.3% |
| Median | 6.0% | 3.4% |
| Interquartile 25% (IQ1) | 3.6% | 2.0% |
| Interquartile 75% (IQ3) | 9.8% | 4.6% |
| Interquartile Range (IQR) | 6.2% | 2.6% |
| Standard Deviation (Sample) | 9.2% | 1.6% |
| Standard Deviation (Population) | 9.1% | 1.6% |
Similar Demographics by Professional Degree
Demographics Similar to Lebanese by Professional Degree
In terms of professional degree, the demographic groups most similar to Lebanese are British (5.0%, a difference of 0.15%), Immigrants from Southern Europe (5.0%, a difference of 0.16%), Maltese (5.0%, a difference of 0.20%), Immigrants from Ukraine (5.0%, a difference of 0.32%), and Immigrants from Uganda (5.0%, a difference of 0.35%).
| Demographics | Rating | Rank | Professional Degree |
| Immigrants | Northern Africa | 98.4 /100 | #103 | Exceptional 5.1% |
| Arabs | 98.2 /100 | #104 | Exceptional 5.0% |
| Immigrants | Uganda | 98.2 /100 | #105 | Exceptional 5.0% |
| Immigrants | Ukraine | 98.2 /100 | #106 | Exceptional 5.0% |
| Maltese | 98.1 /100 | #107 | Exceptional 5.0% |
| Immigrants | Southern Europe | 98.1 /100 | #108 | Exceptional 5.0% |
| British | 98.0 /100 | #109 | Exceptional 5.0% |
| Lebanese | 98.0 /100 | #110 | Exceptional 5.0% |
| Brazilians | 97.4 /100 | #111 | Exceptional 5.0% |
| Taiwanese | 97.3 /100 | #112 | Exceptional 5.0% |
| Immigrants | Pakistan | 97.2 /100 | #113 | Exceptional 5.0% |
| Immigrants | Morocco | 96.8 /100 | #114 | Exceptional 5.0% |
| Moroccans | 96.8 /100 | #115 | Exceptional 5.0% |
| Venezuelans | 96.3 /100 | #116 | Exceptional 4.9% |
| Immigrants | Syria | 96.0 /100 | #117 | Exceptional 4.9% |
Demographics Similar to Immigrants from Somalia by Professional Degree
In terms of professional degree, the demographic groups most similar to Immigrants from Somalia are Subsaharan African (4.1%, a difference of 0.080%), Immigrants from Panama (4.1%, a difference of 0.080%), Immigrants from Nigeria (4.1%, a difference of 0.30%), Yugoslavian (4.1%, a difference of 0.32%), and German (4.1%, a difference of 0.33%).
| Demographics | Rating | Rank | Professional Degree |
| Finns | 18.7 /100 | #201 | Poor 4.2% |
| Immigrants | Iraq | 17.1 /100 | #202 | Poor 4.2% |
| Panamanians | 15.9 /100 | #203 | Poor 4.1% |
| Barbadians | 15.8 /100 | #204 | Poor 4.1% |
| Somalis | 14.8 /100 | #205 | Poor 4.1% |
| Yugoslavians | 13.4 /100 | #206 | Poor 4.1% |
| Sub-Saharan Africans | 12.8 /100 | #207 | Poor 4.1% |
| Immigrants | Somalia | 12.5 /100 | #208 | Poor 4.1% |
| Immigrants | Panama | 12.3 /100 | #209 | Poor 4.1% |
| Immigrants | Nigeria | 11.7 /100 | #210 | Poor 4.1% |
| Germans | 11.6 /100 | #211 | Poor 4.1% |
| Whites/Caucasians | 11.2 /100 | #212 | Poor 4.1% |
| Koreans | 10.7 /100 | #213 | Poor 4.1% |
| Immigrants | Ghana | 10.6 /100 | #214 | Poor 4.1% |
| Portuguese | 10.5 /100 | #215 | Poor 4.1% |