Immigrants from Northern Africa vs Dutch West Indian Professional Degree
COMPARE
Immigrants from Northern Africa
Dutch West Indian
Professional Degree
Professional Degree Comparison
Immigrants from Northern Africa
Dutch West Indians
5.1%
PROFESSIONAL DEGREE
98.4/ 100
METRIC RATING
103rd/ 347
METRIC RANK
3.1%
PROFESSIONAL DEGREE
0.0/ 100
METRIC RATING
327th/ 347
METRIC RANK
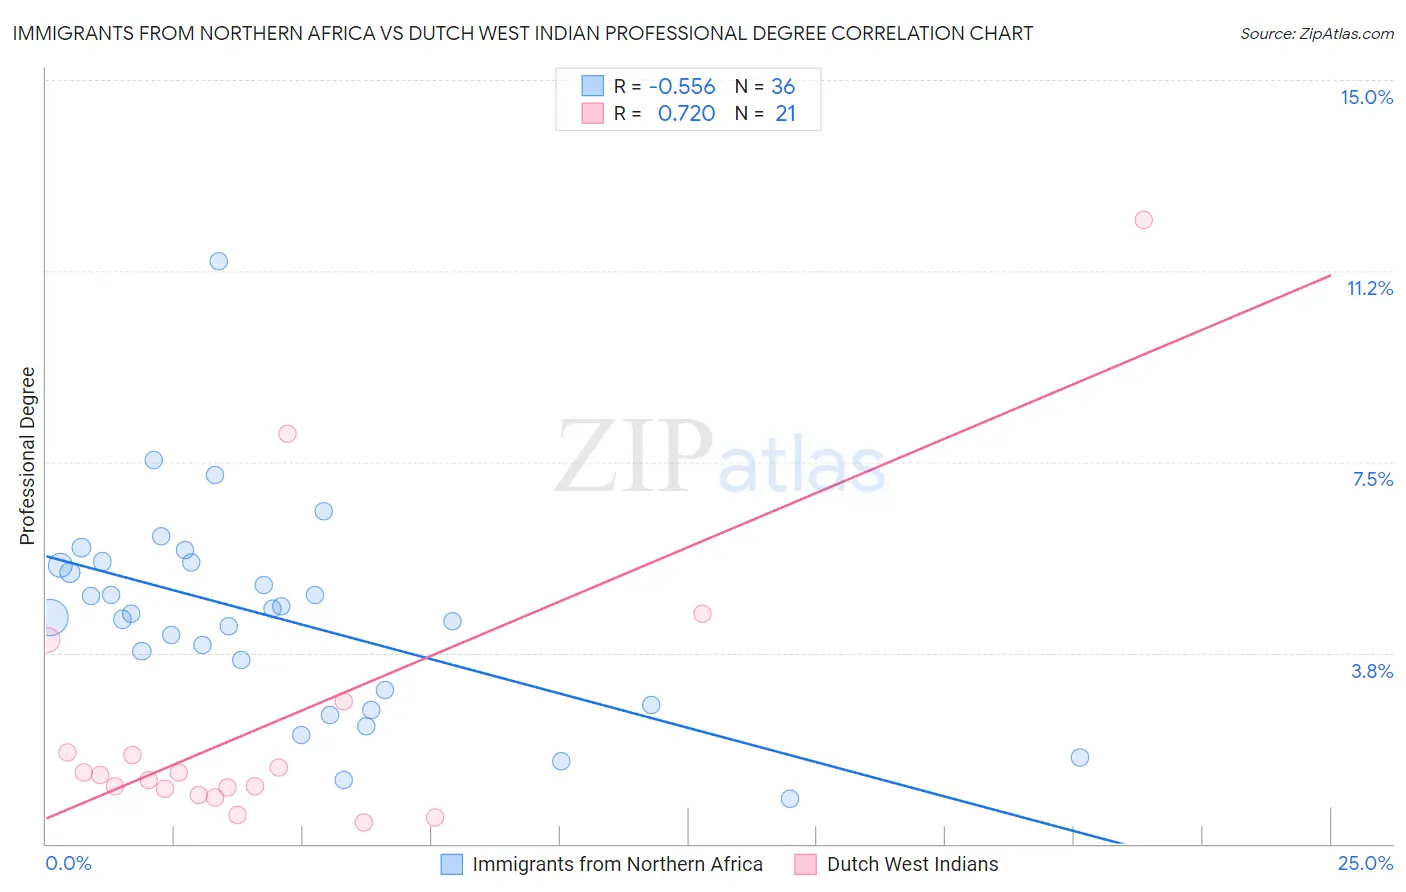
Immigrants from Northern Africa vs Dutch West Indian Professional Degree Correlation Chart
The statistical analysis conducted on geographies consisting of 320,940,889 people shows a substantial negative correlation between the proportion of Immigrants from Northern Africa and percentage of population with at least professional degree education in the United States with a correlation coefficient (R) of -0.556 and weighted average of 5.1%. Similarly, the statistical analysis conducted on geographies consisting of 85,349,686 people shows a strong positive correlation between the proportion of Dutch West Indians and percentage of population with at least professional degree education in the United States with a correlation coefficient (R) of 0.720 and weighted average of 3.1%, a difference of 63.4%.
Professional Degree Correlation Summary
| Measurement | Immigrants from Northern Africa | Dutch West Indian |
| Minimum | 0.89% | 0.42% |
| Maximum | 11.4% | 12.2% |
| Range | 10.5% | 11.8% |
| Mean | 4.4% | 2.4% |
| Median | 4.5% | 1.4% |
| Interquartile 25% (IQ1) | 2.9% | 1.0% |
| Interquartile 75% (IQ3) | 5.5% | 2.3% |
| Interquartile Range (IQR) | 2.6% | 1.3% |
| Standard Deviation (Sample) | 2.0% | 2.9% |
| Standard Deviation (Population) | 2.0% | 2.8% |
Similar Demographics by Professional Degree
Demographics Similar to Immigrants from Northern Africa by Professional Degree
In terms of professional degree, the demographic groups most similar to Immigrants from Northern Africa are Ukrainian (5.1%, a difference of 0.25%), Arab (5.0%, a difference of 0.31%), Immigrants from Egypt (5.1%, a difference of 0.33%), Immigrants from Uganda (5.0%, a difference of 0.34%), and Immigrants from Ukraine (5.0%, a difference of 0.37%).
| Demographics | Rating | Rank | Professional Degree |
| Immigrants | Uzbekistan | 99.2 /100 | #96 | Exceptional 5.2% |
| Syrians | 99.1 /100 | #97 | Exceptional 5.2% |
| Austrians | 99.1 /100 | #98 | Exceptional 5.2% |
| Immigrants | Italy | 99.1 /100 | #99 | Exceptional 5.2% |
| Ugandans | 98.8 /100 | #100 | Exceptional 5.1% |
| Immigrants | Egypt | 98.5 /100 | #101 | Exceptional 5.1% |
| Ukrainians | 98.5 /100 | #102 | Exceptional 5.1% |
| Immigrants | Northern Africa | 98.4 /100 | #103 | Exceptional 5.1% |
| Arabs | 98.2 /100 | #104 | Exceptional 5.0% |
| Immigrants | Uganda | 98.2 /100 | #105 | Exceptional 5.0% |
| Immigrants | Ukraine | 98.2 /100 | #106 | Exceptional 5.0% |
| Maltese | 98.1 /100 | #107 | Exceptional 5.0% |
| Immigrants | Southern Europe | 98.1 /100 | #108 | Exceptional 5.0% |
| British | 98.0 /100 | #109 | Exceptional 5.0% |
| Lebanese | 98.0 /100 | #110 | Exceptional 5.0% |
Demographics Similar to Dutch West Indians by Professional Degree
In terms of professional degree, the demographic groups most similar to Dutch West Indians are Creek (3.1%, a difference of 0.060%), Menominee (3.1%, a difference of 0.10%), Bangladeshi (3.1%, a difference of 0.27%), Immigrants from Cabo Verde (3.1%, a difference of 0.35%), and Kiowa (3.1%, a difference of 0.47%).
| Demographics | Rating | Rank | Professional Degree |
| Seminole | 0.1 /100 | #320 | Tragic 3.2% |
| Tsimshian | 0.0 /100 | #321 | Tragic 3.2% |
| Hispanics or Latinos | 0.0 /100 | #322 | Tragic 3.2% |
| Inupiat | 0.0 /100 | #323 | Tragic 3.2% |
| Crow | 0.0 /100 | #324 | Tragic 3.2% |
| Yaqui | 0.0 /100 | #325 | Tragic 3.2% |
| Menominee | 0.0 /100 | #326 | Tragic 3.1% |
| Dutch West Indians | 0.0 /100 | #327 | Tragic 3.1% |
| Creek | 0.0 /100 | #328 | Tragic 3.1% |
| Bangladeshis | 0.0 /100 | #329 | Tragic 3.1% |
| Immigrants | Cabo Verde | 0.0 /100 | #330 | Tragic 3.1% |
| Kiowa | 0.0 /100 | #331 | Tragic 3.1% |
| Yakama | 0.0 /100 | #332 | Tragic 3.1% |
| Puget Sound Salish | 0.0 /100 | #333 | Tragic 3.1% |
| Pennsylvania Germans | 0.0 /100 | #334 | Tragic 3.0% |