Estonian vs Dutch West Indian Professional Degree
COMPARE
Estonian
Dutch West Indian
Professional Degree
Professional Degree Comparison
Estonians
Dutch West Indians
6.0%
PROFESSIONAL DEGREE
100.0/ 100
METRIC RATING
42nd/ 347
METRIC RANK
3.1%
PROFESSIONAL DEGREE
0.0/ 100
METRIC RATING
327th/ 347
METRIC RANK
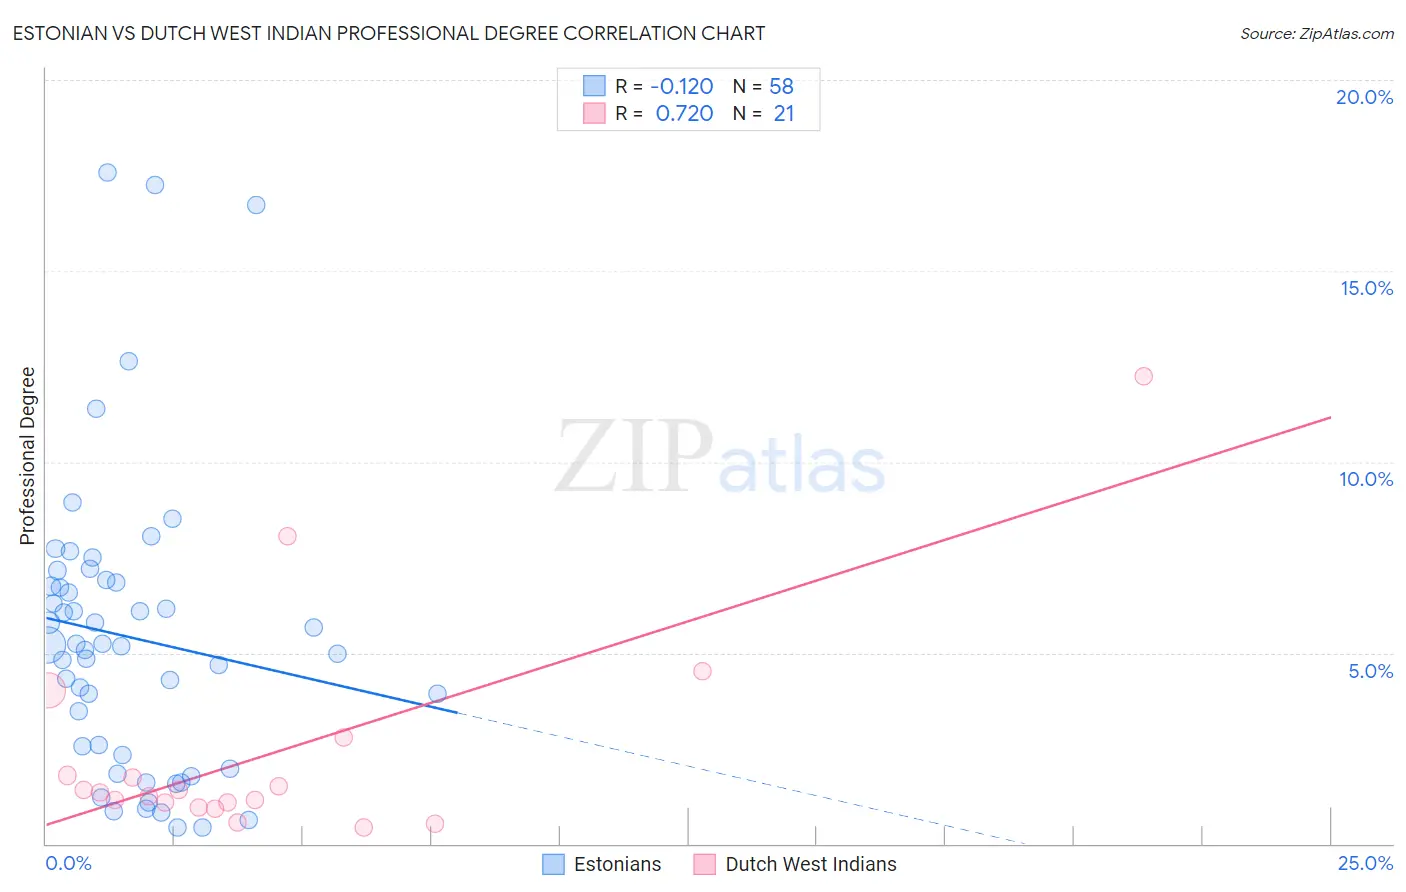
Estonian vs Dutch West Indian Professional Degree Correlation Chart
The statistical analysis conducted on geographies consisting of 123,468,720 people shows a poor negative correlation between the proportion of Estonians and percentage of population with at least professional degree education in the United States with a correlation coefficient (R) of -0.120 and weighted average of 6.0%. Similarly, the statistical analysis conducted on geographies consisting of 85,349,686 people shows a strong positive correlation between the proportion of Dutch West Indians and percentage of population with at least professional degree education in the United States with a correlation coefficient (R) of 0.720 and weighted average of 3.1%, a difference of 92.2%.
Professional Degree Correlation Summary
| Measurement | Estonian | Dutch West Indian |
| Minimum | 0.42% | 0.42% |
| Maximum | 17.6% | 12.2% |
| Range | 17.2% | 11.8% |
| Mean | 5.4% | 2.4% |
| Median | 5.2% | 1.4% |
| Interquartile 25% (IQ1) | 2.3% | 1.0% |
| Interquartile 75% (IQ3) | 6.8% | 2.3% |
| Interquartile Range (IQR) | 4.5% | 1.3% |
| Standard Deviation (Sample) | 3.9% | 2.9% |
| Standard Deviation (Population) | 3.8% | 2.8% |
Similar Demographics by Professional Degree
Demographics Similar to Estonians by Professional Degree
In terms of professional degree, the demographic groups most similar to Estonians are New Zealander (6.0%, a difference of 0.010%), Cambodian (6.0%, a difference of 0.19%), Immigrants from Saudi Arabia (5.9%, a difference of 0.32%), Argentinean (5.9%, a difference of 0.48%), and Immigrants from South Africa (6.0%, a difference of 0.67%).
| Demographics | Rating | Rank | Professional Degree |
| Immigrants | Korea | 100.0 /100 | #35 | Exceptional 6.1% |
| Immigrants | Russia | 100.0 /100 | #36 | Exceptional 6.0% |
| Immigrants | Austria | 100.0 /100 | #37 | Exceptional 6.0% |
| Immigrants | Norway | 100.0 /100 | #38 | Exceptional 6.0% |
| Immigrants | South Africa | 100.0 /100 | #39 | Exceptional 6.0% |
| Cambodians | 100.0 /100 | #40 | Exceptional 6.0% |
| New Zealanders | 100.0 /100 | #41 | Exceptional 6.0% |
| Estonians | 100.0 /100 | #42 | Exceptional 6.0% |
| Immigrants | Saudi Arabia | 100.0 /100 | #43 | Exceptional 5.9% |
| Argentineans | 100.0 /100 | #44 | Exceptional 5.9% |
| Immigrants | South Central Asia | 100.0 /100 | #45 | Exceptional 5.9% |
| Immigrants | Argentina | 100.0 /100 | #46 | Exceptional 5.9% |
| Australians | 100.0 /100 | #47 | Exceptional 5.9% |
| Paraguayans | 100.0 /100 | #48 | Exceptional 5.9% |
| Immigrants | Latvia | 100.0 /100 | #49 | Exceptional 5.8% |
Demographics Similar to Dutch West Indians by Professional Degree
In terms of professional degree, the demographic groups most similar to Dutch West Indians are Creek (3.1%, a difference of 0.060%), Menominee (3.1%, a difference of 0.10%), Bangladeshi (3.1%, a difference of 0.27%), Immigrants from Cabo Verde (3.1%, a difference of 0.35%), and Kiowa (3.1%, a difference of 0.47%).
| Demographics | Rating | Rank | Professional Degree |
| Seminole | 0.1 /100 | #320 | Tragic 3.2% |
| Tsimshian | 0.0 /100 | #321 | Tragic 3.2% |
| Hispanics or Latinos | 0.0 /100 | #322 | Tragic 3.2% |
| Inupiat | 0.0 /100 | #323 | Tragic 3.2% |
| Crow | 0.0 /100 | #324 | Tragic 3.2% |
| Yaqui | 0.0 /100 | #325 | Tragic 3.2% |
| Menominee | 0.0 /100 | #326 | Tragic 3.1% |
| Dutch West Indians | 0.0 /100 | #327 | Tragic 3.1% |
| Creek | 0.0 /100 | #328 | Tragic 3.1% |
| Bangladeshis | 0.0 /100 | #329 | Tragic 3.1% |
| Immigrants | Cabo Verde | 0.0 /100 | #330 | Tragic 3.1% |
| Kiowa | 0.0 /100 | #331 | Tragic 3.1% |
| Yakama | 0.0 /100 | #332 | Tragic 3.1% |
| Puget Sound Salish | 0.0 /100 | #333 | Tragic 3.1% |
| Pennsylvania Germans | 0.0 /100 | #334 | Tragic 3.0% |