Latvian vs Immigrants from Eastern Asia No Schooling Completed
COMPARE
Latvian
Immigrants from Eastern Asia
No Schooling Completed
No Schooling Completed Comparison
Latvians
Immigrants from Eastern Asia
1.5%
NO SCHOOLING COMPLETED
100.0/ 100
METRIC RATING
34th/ 347
METRIC RANK
2.4%
NO SCHOOLING COMPLETED
2.0/ 100
METRIC RATING
237th/ 347
METRIC RANK
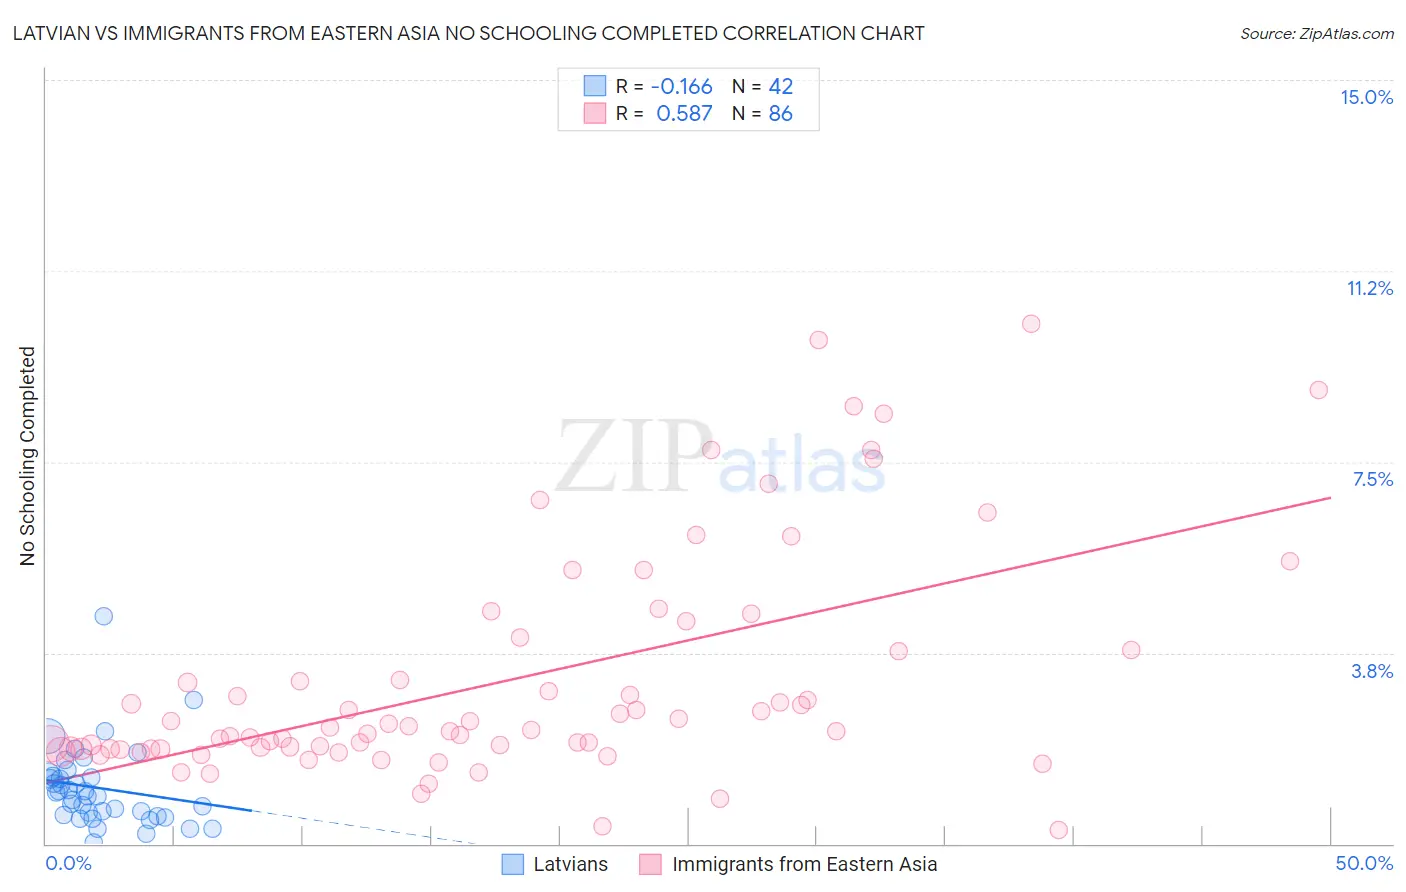
Latvian vs Immigrants from Eastern Asia No Schooling Completed Correlation Chart
The statistical analysis conducted on geographies consisting of 219,073,605 people shows a poor negative correlation between the proportion of Latvians and percentage of population with no schooling in the United States with a correlation coefficient (R) of -0.166 and weighted average of 1.5%. Similarly, the statistical analysis conducted on geographies consisting of 491,002,853 people shows a substantial positive correlation between the proportion of Immigrants from Eastern Asia and percentage of population with no schooling in the United States with a correlation coefficient (R) of 0.587 and weighted average of 2.4%, a difference of 53.2%.
No Schooling Completed Correlation Summary
| Measurement | Latvian | Immigrants from Eastern Asia |
| Minimum | 0.028% | 0.26% |
| Maximum | 4.5% | 10.2% |
| Range | 4.4% | 10.0% |
| Mean | 1.1% | 3.2% |
| Median | 0.97% | 2.3% |
| Interquartile 25% (IQ1) | 0.56% | 1.9% |
| Interquartile 75% (IQ3) | 1.3% | 3.8% |
| Interquartile Range (IQR) | 0.76% | 1.9% |
| Standard Deviation (Sample) | 0.80% | 2.2% |
| Standard Deviation (Population) | 0.79% | 2.2% |
Similar Demographics by No Schooling Completed
Demographics Similar to Latvians by No Schooling Completed
In terms of no schooling completed, the demographic groups most similar to Latvians are Italian (1.5%, a difference of 0.25%), Swiss (1.5%, a difference of 0.94%), Eastern European (1.6%, a difference of 0.95%), Inupiat (1.5%, a difference of 1.3%), and British (1.5%, a difference of 1.4%).
| Demographics | Rating | Rank | No Schooling Completed |
| Scandinavians | 100.0 /100 | #27 | Exceptional 1.5% |
| French Canadians | 100.0 /100 | #28 | Exceptional 1.5% |
| Lumbee | 100.0 /100 | #29 | Exceptional 1.5% |
| British | 100.0 /100 | #30 | Exceptional 1.5% |
| Inupiat | 100.0 /100 | #31 | Exceptional 1.5% |
| Swiss | 100.0 /100 | #32 | Exceptional 1.5% |
| Italians | 100.0 /100 | #33 | Exceptional 1.5% |
| Latvians | 100.0 /100 | #34 | Exceptional 1.5% |
| Eastern Europeans | 100.0 /100 | #35 | Exceptional 1.6% |
| Aleuts | 99.9 /100 | #36 | Exceptional 1.6% |
| Belgians | 99.9 /100 | #37 | Exceptional 1.6% |
| Northern Europeans | 99.9 /100 | #38 | Exceptional 1.6% |
| Native Hawaiians | 99.9 /100 | #39 | Exceptional 1.6% |
| Luxembourgers | 99.9 /100 | #40 | Exceptional 1.6% |
| Hungarians | 99.9 /100 | #41 | Exceptional 1.6% |
Demographics Similar to Immigrants from Eastern Asia by No Schooling Completed
In terms of no schooling completed, the demographic groups most similar to Immigrants from Eastern Asia are Iraqi (2.4%, a difference of 0.20%), Paiute (2.4%, a difference of 0.21%), Liberian (2.4%, a difference of 0.33%), Immigrants from Senegal (2.4%, a difference of 0.56%), and Korean (2.4%, a difference of 0.62%).
| Demographics | Rating | Rank | No Schooling Completed |
| Puerto Ricans | 3.4 /100 | #230 | Tragic 2.3% |
| Immigrants | Uruguay | 3.4 /100 | #231 | Tragic 2.3% |
| Colombians | 3.2 /100 | #232 | Tragic 2.3% |
| Immigrants | Malaysia | 2.8 /100 | #233 | Tragic 2.3% |
| Nigerians | 2.6 /100 | #234 | Tragic 2.3% |
| Immigrants | Western Asia | 2.6 /100 | #235 | Tragic 2.3% |
| Iraqis | 2.2 /100 | #236 | Tragic 2.4% |
| Immigrants | Eastern Asia | 2.0 /100 | #237 | Tragic 2.4% |
| Paiute | 1.9 /100 | #238 | Tragic 2.4% |
| Liberians | 1.8 /100 | #239 | Tragic 2.4% |
| Immigrants | Senegal | 1.7 /100 | #240 | Tragic 2.4% |
| Koreans | 1.7 /100 | #241 | Tragic 2.4% |
| Immigrants | Indonesia | 1.5 /100 | #242 | Tragic 2.4% |
| South Americans | 1.5 /100 | #243 | Tragic 2.4% |
| Peruvians | 1.4 /100 | #244 | Tragic 2.4% |