Latvian vs Immigrants from Ecuador No Schooling Completed
COMPARE
Latvian
Immigrants from Ecuador
No Schooling Completed
No Schooling Completed Comparison
Latvians
Immigrants from Ecuador
1.5%
NO SCHOOLING COMPLETED
100.0/ 100
METRIC RATING
34th/ 347
METRIC RANK
3.1%
NO SCHOOLING COMPLETED
0.0/ 100
METRIC RATING
316th/ 347
METRIC RANK
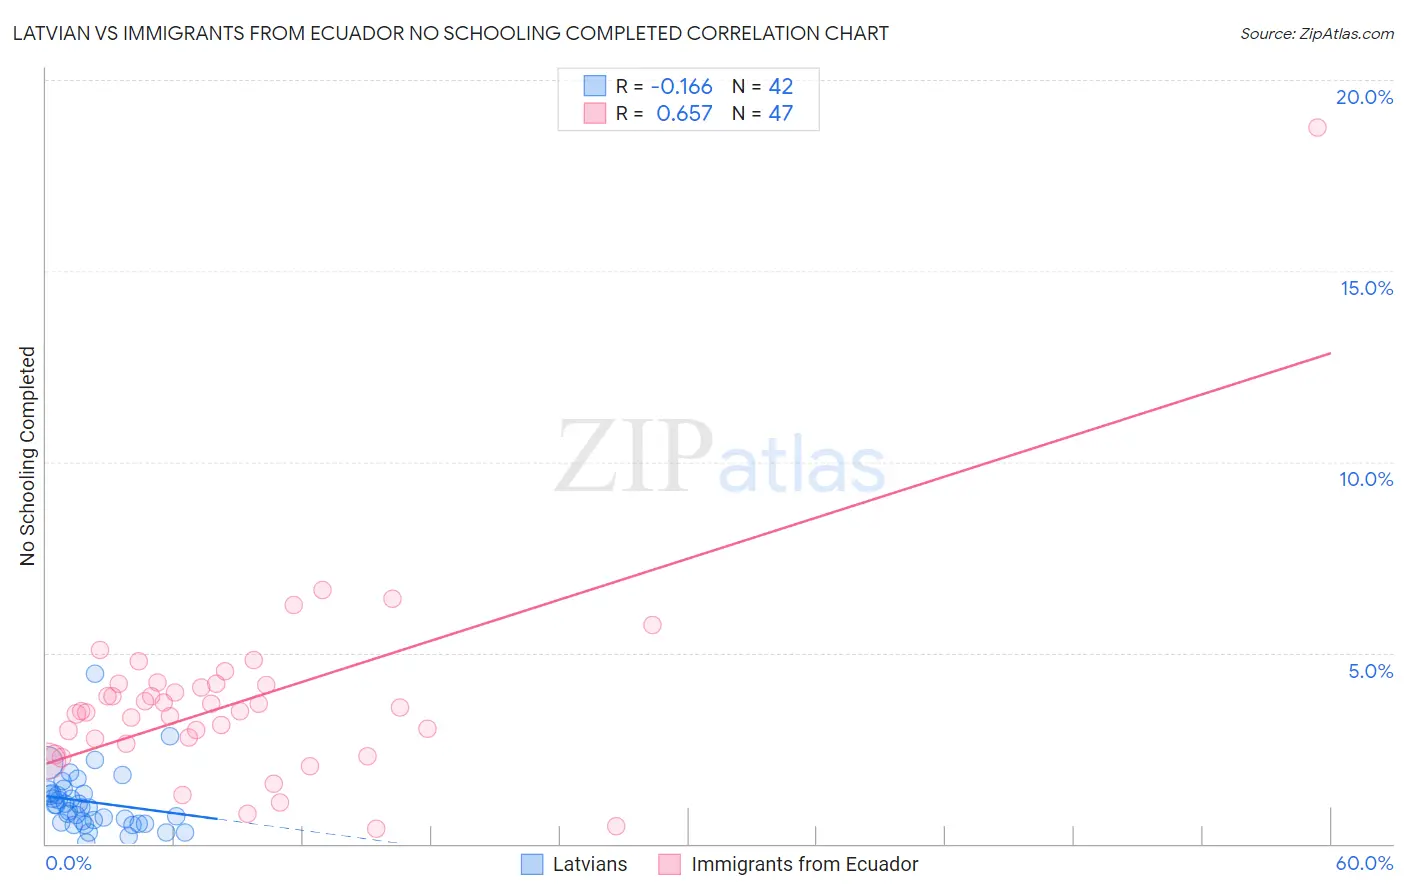
Latvian vs Immigrants from Ecuador No Schooling Completed Correlation Chart
The statistical analysis conducted on geographies consisting of 219,073,605 people shows a poor negative correlation between the proportion of Latvians and percentage of population with no schooling in the United States with a correlation coefficient (R) of -0.166 and weighted average of 1.5%. Similarly, the statistical analysis conducted on geographies consisting of 269,548,535 people shows a significant positive correlation between the proportion of Immigrants from Ecuador and percentage of population with no schooling in the United States with a correlation coefficient (R) of 0.657 and weighted average of 3.1%, a difference of 100.1%.
No Schooling Completed Correlation Summary
| Measurement | Latvian | Immigrants from Ecuador |
| Minimum | 0.028% | 0.40% |
| Maximum | 4.5% | 18.8% |
| Range | 4.4% | 18.3% |
| Mean | 1.1% | 3.7% |
| Median | 0.97% | 3.5% |
| Interquartile 25% (IQ1) | 0.56% | 2.6% |
| Interquartile 75% (IQ3) | 1.3% | 4.2% |
| Interquartile Range (IQR) | 0.76% | 1.5% |
| Standard Deviation (Sample) | 0.80% | 2.6% |
| Standard Deviation (Population) | 0.79% | 2.6% |
Similar Demographics by No Schooling Completed
Demographics Similar to Latvians by No Schooling Completed
In terms of no schooling completed, the demographic groups most similar to Latvians are Italian (1.5%, a difference of 0.25%), Swiss (1.5%, a difference of 0.94%), Eastern European (1.6%, a difference of 0.95%), Inupiat (1.5%, a difference of 1.3%), and British (1.5%, a difference of 1.4%).
| Demographics | Rating | Rank | No Schooling Completed |
| Scandinavians | 100.0 /100 | #27 | Exceptional 1.5% |
| French Canadians | 100.0 /100 | #28 | Exceptional 1.5% |
| Lumbee | 100.0 /100 | #29 | Exceptional 1.5% |
| British | 100.0 /100 | #30 | Exceptional 1.5% |
| Inupiat | 100.0 /100 | #31 | Exceptional 1.5% |
| Swiss | 100.0 /100 | #32 | Exceptional 1.5% |
| Italians | 100.0 /100 | #33 | Exceptional 1.5% |
| Latvians | 100.0 /100 | #34 | Exceptional 1.5% |
| Eastern Europeans | 100.0 /100 | #35 | Exceptional 1.6% |
| Aleuts | 99.9 /100 | #36 | Exceptional 1.6% |
| Belgians | 99.9 /100 | #37 | Exceptional 1.6% |
| Northern Europeans | 99.9 /100 | #38 | Exceptional 1.6% |
| Native Hawaiians | 99.9 /100 | #39 | Exceptional 1.6% |
| Luxembourgers | 99.9 /100 | #40 | Exceptional 1.6% |
| Hungarians | 99.9 /100 | #41 | Exceptional 1.6% |
Demographics Similar to Immigrants from Ecuador by No Schooling Completed
In terms of no schooling completed, the demographic groups most similar to Immigrants from Ecuador are Immigrants from Nicaragua (3.1%, a difference of 0.36%), Cape Verdean (3.1%, a difference of 0.49%), Immigrants from Belize (3.1%, a difference of 0.60%), Honduran (3.1%, a difference of 0.69%), and Immigrants from Guyana (3.1%, a difference of 1.2%).
| Demographics | Rating | Rank | No Schooling Completed |
| Hispanics or Latinos | 0.0 /100 | #309 | Tragic 3.0% |
| Guyanese | 0.0 /100 | #310 | Tragic 3.0% |
| Immigrants | Azores | 0.0 /100 | #311 | Tragic 3.0% |
| Sri Lankans | 0.0 /100 | #312 | Tragic 3.0% |
| Hondurans | 0.0 /100 | #313 | Tragic 3.1% |
| Immigrants | Belize | 0.0 /100 | #314 | Tragic 3.1% |
| Immigrants | Nicaragua | 0.0 /100 | #315 | Tragic 3.1% |
| Immigrants | Ecuador | 0.0 /100 | #316 | Tragic 3.1% |
| Cape Verdeans | 0.0 /100 | #317 | Tragic 3.1% |
| Immigrants | Guyana | 0.0 /100 | #318 | Tragic 3.1% |
| Immigrants | Burma/Myanmar | 0.0 /100 | #319 | Tragic 3.1% |
| Immigrants | Bangladesh | 0.0 /100 | #320 | Tragic 3.1% |
| Immigrants | Laos | 0.0 /100 | #321 | Tragic 3.1% |
| Immigrants | Honduras | 0.0 /100 | #322 | Tragic 3.2% |
| Vietnamese | 0.0 /100 | #323 | Tragic 3.2% |