Latvian vs Immigrants from South Central Asia No Schooling Completed
COMPARE
Latvian
Immigrants from South Central Asia
No Schooling Completed
No Schooling Completed Comparison
Latvians
Immigrants from South Central Asia
1.5%
NO SCHOOLING COMPLETED
100.0/ 100
METRIC RATING
34th/ 347
METRIC RANK
2.0%
NO SCHOOLING COMPLETED
80.0/ 100
METRIC RATING
143rd/ 347
METRIC RANK
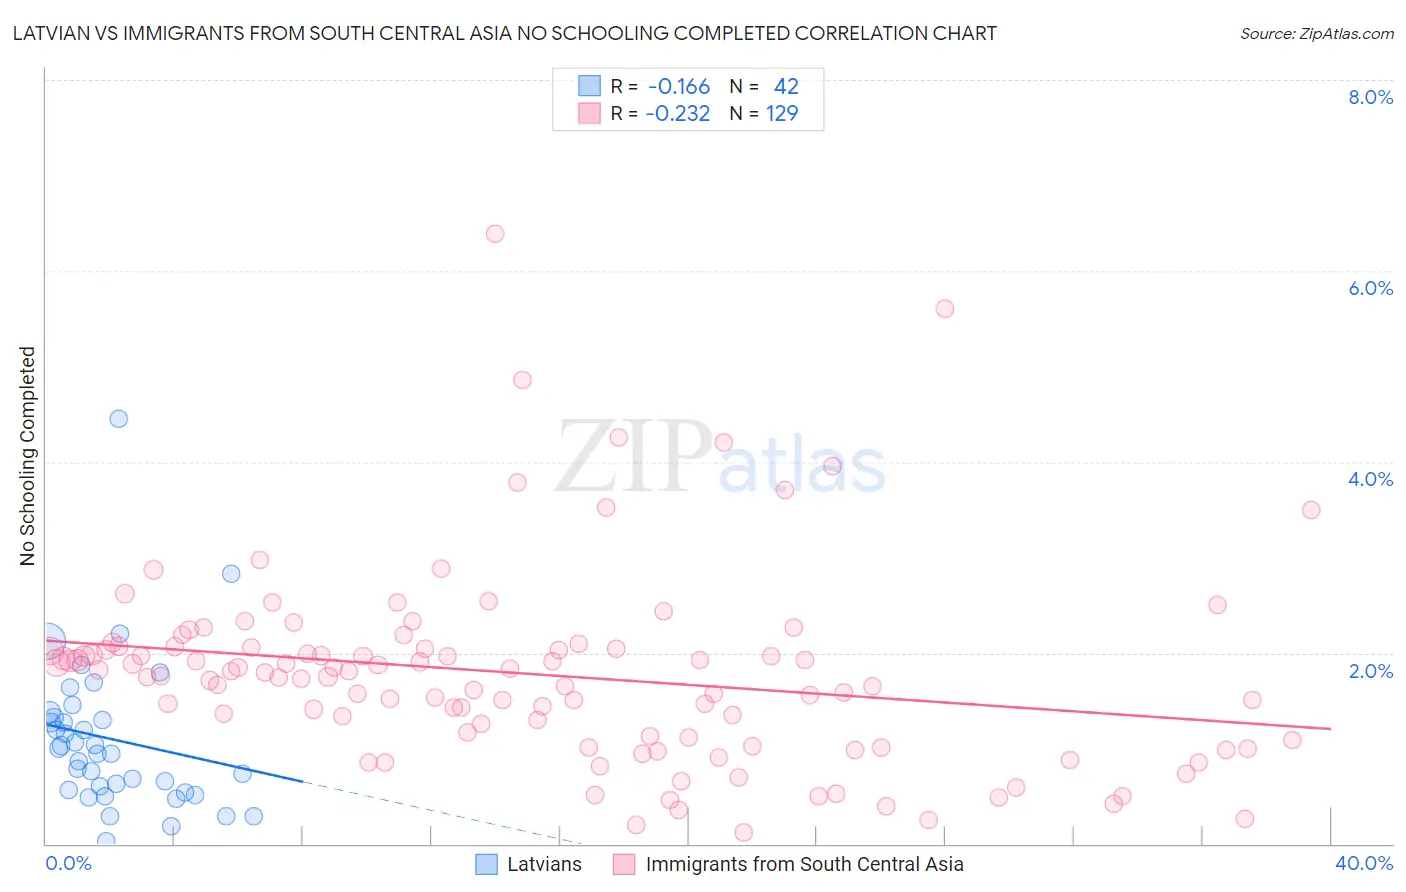
Latvian vs Immigrants from South Central Asia No Schooling Completed Correlation Chart
The statistical analysis conducted on geographies consisting of 219,073,605 people shows a poor negative correlation between the proportion of Latvians and percentage of population with no schooling in the United States with a correlation coefficient (R) of -0.166 and weighted average of 1.5%. Similarly, the statistical analysis conducted on geographies consisting of 466,715,377 people shows a weak negative correlation between the proportion of Immigrants from South Central Asia and percentage of population with no schooling in the United States with a correlation coefficient (R) of -0.232 and weighted average of 2.0%, a difference of 29.3%.
No Schooling Completed Correlation Summary
| Measurement | Latvian | Immigrants from South Central Asia |
| Minimum | 0.028% | 0.12% |
| Maximum | 4.5% | 6.4% |
| Range | 4.4% | 6.3% |
| Mean | 1.1% | 1.8% |
| Median | 0.97% | 1.8% |
| Interquartile 25% (IQ1) | 0.56% | 1.1% |
| Interquartile 75% (IQ3) | 1.3% | 2.1% |
| Interquartile Range (IQR) | 0.76% | 0.95% |
| Standard Deviation (Sample) | 0.80% | 1.0% |
| Standard Deviation (Population) | 0.79% | 1.0% |
Similar Demographics by No Schooling Completed
Demographics Similar to Latvians by No Schooling Completed
In terms of no schooling completed, the demographic groups most similar to Latvians are Italian (1.5%, a difference of 0.25%), Swiss (1.5%, a difference of 0.94%), Eastern European (1.6%, a difference of 0.95%), Inupiat (1.5%, a difference of 1.3%), and British (1.5%, a difference of 1.4%).
| Demographics | Rating | Rank | No Schooling Completed |
| Scandinavians | 100.0 /100 | #27 | Exceptional 1.5% |
| French Canadians | 100.0 /100 | #28 | Exceptional 1.5% |
| Lumbee | 100.0 /100 | #29 | Exceptional 1.5% |
| British | 100.0 /100 | #30 | Exceptional 1.5% |
| Inupiat | 100.0 /100 | #31 | Exceptional 1.5% |
| Swiss | 100.0 /100 | #32 | Exceptional 1.5% |
| Italians | 100.0 /100 | #33 | Exceptional 1.5% |
| Latvians | 100.0 /100 | #34 | Exceptional 1.5% |
| Eastern Europeans | 100.0 /100 | #35 | Exceptional 1.6% |
| Aleuts | 99.9 /100 | #36 | Exceptional 1.6% |
| Belgians | 99.9 /100 | #37 | Exceptional 1.6% |
| Northern Europeans | 99.9 /100 | #38 | Exceptional 1.6% |
| Native Hawaiians | 99.9 /100 | #39 | Exceptional 1.6% |
| Luxembourgers | 99.9 /100 | #40 | Exceptional 1.6% |
| Hungarians | 99.9 /100 | #41 | Exceptional 1.6% |
Demographics Similar to Immigrants from South Central Asia by No Schooling Completed
In terms of no schooling completed, the demographic groups most similar to Immigrants from South Central Asia are Alsatian (2.0%, a difference of 0.20%), Immigrants from Iran (2.0%, a difference of 0.21%), Venezuelan (2.0%, a difference of 0.35%), Immigrants from Moldova (2.0%, a difference of 0.42%), and Soviet Union (2.0%, a difference of 0.60%).
| Demographics | Rating | Rank | No Schooling Completed |
| Burmese | 88.2 /100 | #136 | Excellent 1.9% |
| Filipinos | 85.5 /100 | #137 | Excellent 2.0% |
| Immigrants | Israel | 85.4 /100 | #138 | Excellent 2.0% |
| Jordanians | 84.5 /100 | #139 | Excellent 2.0% |
| Marshallese | 83.5 /100 | #140 | Excellent 2.0% |
| Immigrants | Greece | 83.5 /100 | #141 | Excellent 2.0% |
| Venezuelans | 81.5 /100 | #142 | Excellent 2.0% |
| Immigrants | South Central Asia | 80.0 /100 | #143 | Good 2.0% |
| Alsatians | 79.1 /100 | #144 | Good 2.0% |
| Immigrants | Iran | 79.0 /100 | #145 | Good 2.0% |
| Immigrants | Moldova | 78.0 /100 | #146 | Good 2.0% |
| Soviet Union | 77.1 /100 | #147 | Good 2.0% |
| Shoshone | 76.7 /100 | #148 | Good 2.0% |
| Immigrants | North Macedonia | 75.9 /100 | #149 | Good 2.0% |
| Blackfeet | 72.9 /100 | #150 | Good 2.0% |