Latvian vs Immigrants from Nepal No Schooling Completed
COMPARE
Latvian
Immigrants from Nepal
No Schooling Completed
No Schooling Completed Comparison
Latvians
Immigrants from Nepal
1.5%
NO SCHOOLING COMPLETED
100.0/ 100
METRIC RATING
34th/ 347
METRIC RANK
2.3%
NO SCHOOLING COMPLETED
6.4/ 100
METRIC RATING
218th/ 347
METRIC RANK
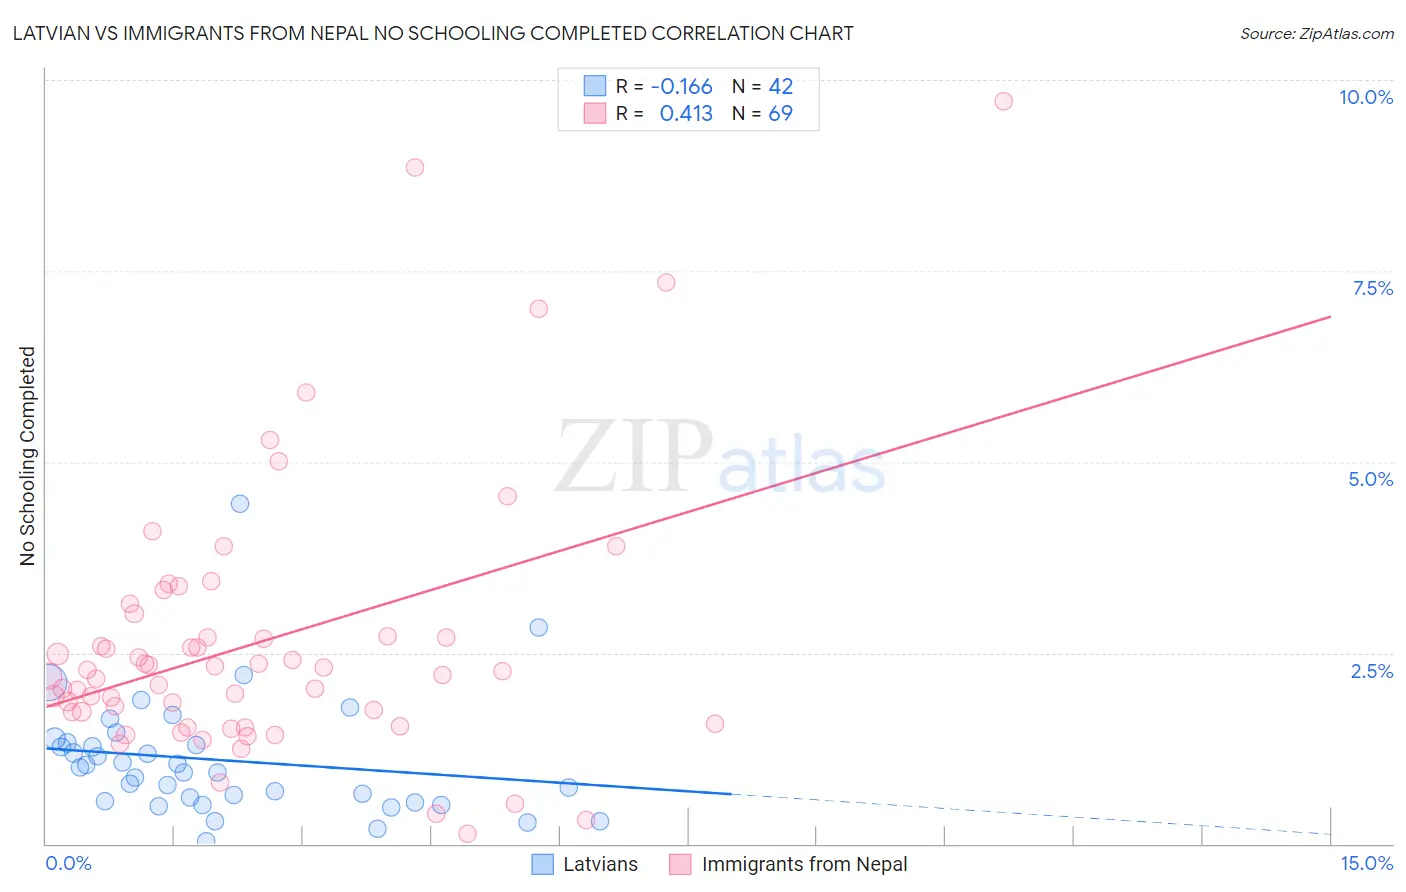
Latvian vs Immigrants from Nepal No Schooling Completed Correlation Chart
The statistical analysis conducted on geographies consisting of 219,073,605 people shows a poor negative correlation between the proportion of Latvians and percentage of population with no schooling in the United States with a correlation coefficient (R) of -0.166 and weighted average of 1.5%. Similarly, the statistical analysis conducted on geographies consisting of 186,155,047 people shows a moderate positive correlation between the proportion of Immigrants from Nepal and percentage of population with no schooling in the United States with a correlation coefficient (R) of 0.413 and weighted average of 2.3%, a difference of 47.8%.
No Schooling Completed Correlation Summary
| Measurement | Latvian | Immigrants from Nepal |
| Minimum | 0.028% | 0.12% |
| Maximum | 4.5% | 9.7% |
| Range | 4.4% | 9.6% |
| Mean | 1.1% | 2.6% |
| Median | 0.97% | 2.3% |
| Interquartile 25% (IQ1) | 0.56% | 1.6% |
| Interquartile 75% (IQ3) | 1.3% | 2.9% |
| Interquartile Range (IQR) | 0.76% | 1.2% |
| Standard Deviation (Sample) | 0.80% | 1.8% |
| Standard Deviation (Population) | 0.79% | 1.8% |
Similar Demographics by No Schooling Completed
Demographics Similar to Latvians by No Schooling Completed
In terms of no schooling completed, the demographic groups most similar to Latvians are Italian (1.5%, a difference of 0.25%), Swiss (1.5%, a difference of 0.94%), Eastern European (1.6%, a difference of 0.95%), Inupiat (1.5%, a difference of 1.3%), and British (1.5%, a difference of 1.4%).
| Demographics | Rating | Rank | No Schooling Completed |
| Scandinavians | 100.0 /100 | #27 | Exceptional 1.5% |
| French Canadians | 100.0 /100 | #28 | Exceptional 1.5% |
| Lumbee | 100.0 /100 | #29 | Exceptional 1.5% |
| British | 100.0 /100 | #30 | Exceptional 1.5% |
| Inupiat | 100.0 /100 | #31 | Exceptional 1.5% |
| Swiss | 100.0 /100 | #32 | Exceptional 1.5% |
| Italians | 100.0 /100 | #33 | Exceptional 1.5% |
| Latvians | 100.0 /100 | #34 | Exceptional 1.5% |
| Eastern Europeans | 100.0 /100 | #35 | Exceptional 1.6% |
| Aleuts | 99.9 /100 | #36 | Exceptional 1.6% |
| Belgians | 99.9 /100 | #37 | Exceptional 1.6% |
| Northern Europeans | 99.9 /100 | #38 | Exceptional 1.6% |
| Native Hawaiians | 99.9 /100 | #39 | Exceptional 1.6% |
| Luxembourgers | 99.9 /100 | #40 | Exceptional 1.6% |
| Hungarians | 99.9 /100 | #41 | Exceptional 1.6% |
Demographics Similar to Immigrants from Nepal by No Schooling Completed
In terms of no schooling completed, the demographic groups most similar to Immigrants from Nepal are Immigrants from Syria (2.3%, a difference of 0.11%), Tongan (2.3%, a difference of 0.19%), Immigrants from Zaire (2.3%, a difference of 0.39%), Senegalese (2.3%, a difference of 0.44%), and Immigrants from Costa Rica (2.3%, a difference of 0.70%).
| Demographics | Rating | Rank | No Schooling Completed |
| Immigrants | Panama | 8.8 /100 | #211 | Tragic 2.3% |
| Immigrants | Morocco | 8.7 /100 | #212 | Tragic 2.3% |
| Ute | 8.2 /100 | #213 | Tragic 2.3% |
| Samoans | 8.2 /100 | #214 | Tragic 2.3% |
| Immigrants | Zaire | 7.2 /100 | #215 | Tragic 2.3% |
| Tongans | 6.8 /100 | #216 | Tragic 2.3% |
| Immigrants | Syria | 6.6 /100 | #217 | Tragic 2.3% |
| Immigrants | Nepal | 6.4 /100 | #218 | Tragic 2.3% |
| Senegalese | 5.6 /100 | #219 | Tragic 2.3% |
| Immigrants | Costa Rica | 5.1 /100 | #220 | Tragic 2.3% |
| Immigrants | Sudan | 5.0 /100 | #221 | Tragic 2.3% |
| Sub-Saharan Africans | 4.7 /100 | #222 | Tragic 2.3% |
| Immigrants | Lebanon | 4.5 /100 | #223 | Tragic 2.3% |
| Tohono O'odham | 4.1 /100 | #224 | Tragic 2.3% |
| Sudanese | 4.1 /100 | #225 | Tragic 2.3% |