Latvian vs Immigrants from Oceania Associate's Degree
COMPARE
Latvian
Immigrants from Oceania
Associate's Degree
Associate's Degree Comparison
Latvians
Immigrants from Oceania
53.9%
ASSOCIATE'S DEGREE
100.0/ 100
METRIC RATING
27th/ 347
METRIC RANK
45.8%
ASSOCIATE'S DEGREE
34.7/ 100
METRIC RATING
189th/ 347
METRIC RANK
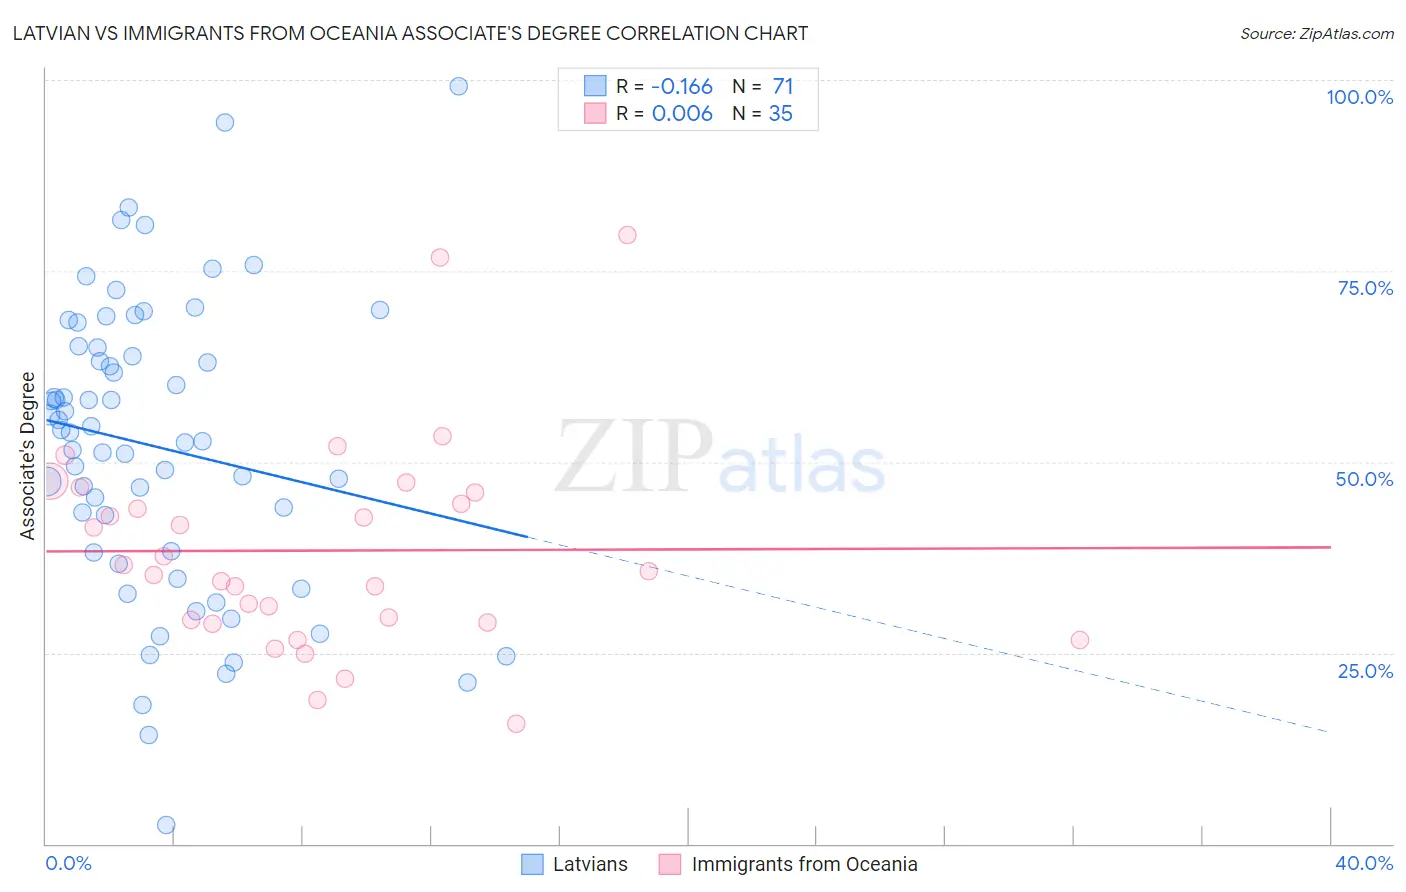
Latvian vs Immigrants from Oceania Associate's Degree Correlation Chart
The statistical analysis conducted on geographies consisting of 220,726,880 people shows a poor negative correlation between the proportion of Latvians and percentage of population with at least associate's degree education in the United States with a correlation coefficient (R) of -0.166 and weighted average of 53.9%. Similarly, the statistical analysis conducted on geographies consisting of 305,516,094 people shows no correlation between the proportion of Immigrants from Oceania and percentage of population with at least associate's degree education in the United States with a correlation coefficient (R) of 0.006 and weighted average of 45.8%, a difference of 17.7%.
Associate's Degree Correlation Summary
| Measurement | Latvian | Immigrants from Oceania |
| Minimum | 2.4% | 15.7% |
| Maximum | 99.2% | 79.8% |
| Range | 96.7% | 64.1% |
| Mean | 51.9% | 38.4% |
| Median | 53.9% | 35.7% |
| Interquartile 25% (IQ1) | 38.1% | 28.9% |
| Interquartile 75% (IQ3) | 64.9% | 46.0% |
| Interquartile Range (IQR) | 26.9% | 17.0% |
| Standard Deviation (Sample) | 19.2% | 13.8% |
| Standard Deviation (Population) | 19.1% | 13.6% |
Similar Demographics by Associate's Degree
Demographics Similar to Latvians by Associate's Degree
In terms of associate's degree, the demographic groups most similar to Latvians are Turkish (53.9%, a difference of 0.070%), Immigrants from France (53.9%, a difference of 0.090%), Immigrants from Sri Lanka (53.7%, a difference of 0.50%), Immigrants from Northern Europe (53.5%, a difference of 0.87%), and Immigrants from Turkey (53.4%, a difference of 0.90%).
| Demographics | Rating | Rank | Associate's Degree |
| Cambodians | 100.0 /100 | #20 | Exceptional 54.6% |
| Immigrants | Sweden | 100.0 /100 | #21 | Exceptional 54.6% |
| Immigrants | Japan | 100.0 /100 | #22 | Exceptional 54.6% |
| Burmese | 100.0 /100 | #23 | Exceptional 54.6% |
| Immigrants | Korea | 100.0 /100 | #24 | Exceptional 54.5% |
| Immigrants | Switzerland | 100.0 /100 | #25 | Exceptional 54.5% |
| Immigrants | Belgium | 100.0 /100 | #26 | Exceptional 54.5% |
| Latvians | 100.0 /100 | #27 | Exceptional 53.9% |
| Turks | 100.0 /100 | #28 | Exceptional 53.9% |
| Immigrants | France | 100.0 /100 | #29 | Exceptional 53.9% |
| Immigrants | Sri Lanka | 100.0 /100 | #30 | Exceptional 53.7% |
| Immigrants | Northern Europe | 100.0 /100 | #31 | Exceptional 53.5% |
| Immigrants | Turkey | 100.0 /100 | #32 | Exceptional 53.4% |
| Israelis | 100.0 /100 | #33 | Exceptional 53.4% |
| Bulgarians | 100.0 /100 | #34 | Exceptional 53.3% |
Demographics Similar to Immigrants from Oceania by Associate's Degree
In terms of associate's degree, the demographic groups most similar to Immigrants from Oceania are Immigrants from Uruguay (45.8%, a difference of 0.060%), Ghanaian (45.8%, a difference of 0.060%), Vietnamese (45.8%, a difference of 0.060%), Korean (45.8%, a difference of 0.070%), and Celtic (45.8%, a difference of 0.12%).
| Demographics | Rating | Rank | Associate's Degree |
| Swiss | 40.4 /100 | #182 | Average 46.0% |
| Yugoslavians | 40.2 /100 | #183 | Average 46.0% |
| Czechoslovakians | 40.0 /100 | #184 | Average 46.0% |
| Costa Ricans | 38.6 /100 | #185 | Fair 46.0% |
| Welsh | 37.9 /100 | #186 | Fair 45.9% |
| Immigrants | Uruguay | 35.5 /100 | #187 | Fair 45.8% |
| Ghanaians | 35.5 /100 | #188 | Fair 45.8% |
| Immigrants | Oceania | 34.7 /100 | #189 | Fair 45.8% |
| Vietnamese | 34.0 /100 | #190 | Fair 45.8% |
| Koreans | 33.8 /100 | #191 | Fair 45.8% |
| Celtics | 33.3 /100 | #192 | Fair 45.8% |
| Immigrants | Cameroon | 31.0 /100 | #193 | Fair 45.7% |
| Immigrants | Peru | 27.6 /100 | #194 | Fair 45.5% |
| Germans | 26.5 /100 | #195 | Fair 45.5% |
| French | 25.6 /100 | #196 | Fair 45.4% |