Latvian vs Immigrants from Portugal Associate's Degree
COMPARE
Latvian
Immigrants from Portugal
Associate's Degree
Associate's Degree Comparison
Latvians
Immigrants from Portugal
53.9%
ASSOCIATE'S DEGREE
100.0/ 100
METRIC RATING
27th/ 347
METRIC RANK
40.1%
ASSOCIATE'S DEGREE
0.1/ 100
METRIC RATING
281st/ 347
METRIC RANK
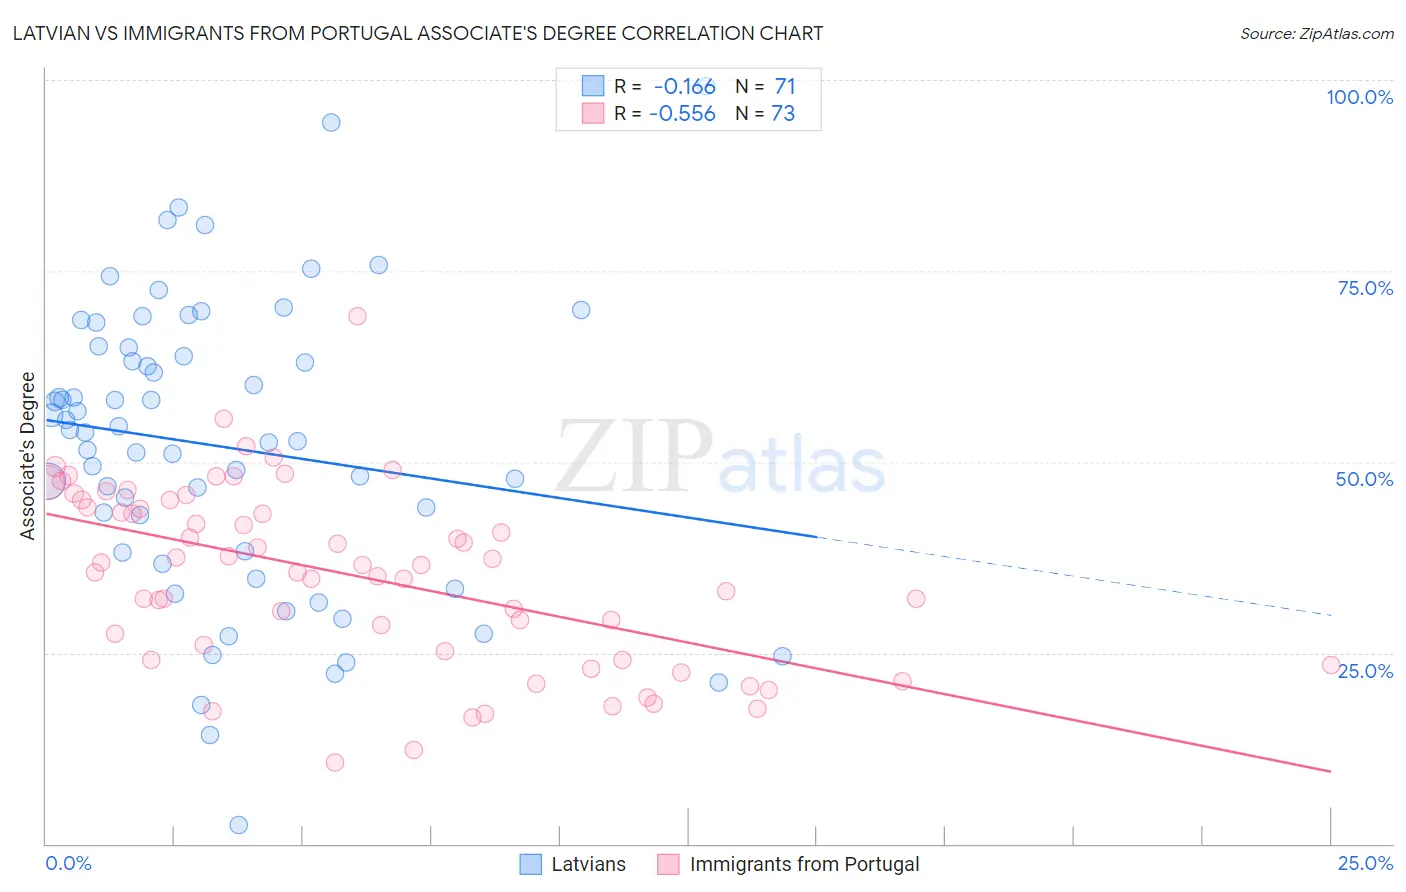
Latvian vs Immigrants from Portugal Associate's Degree Correlation Chart
The statistical analysis conducted on geographies consisting of 220,726,880 people shows a poor negative correlation between the proportion of Latvians and percentage of population with at least associate's degree education in the United States with a correlation coefficient (R) of -0.166 and weighted average of 53.9%. Similarly, the statistical analysis conducted on geographies consisting of 174,792,107 people shows a substantial negative correlation between the proportion of Immigrants from Portugal and percentage of population with at least associate's degree education in the United States with a correlation coefficient (R) of -0.556 and weighted average of 40.1%, a difference of 34.3%.
Associate's Degree Correlation Summary
| Measurement | Latvian | Immigrants from Portugal |
| Minimum | 2.4% | 10.6% |
| Maximum | 99.2% | 69.0% |
| Range | 96.7% | 58.4% |
| Mean | 51.9% | 35.1% |
| Median | 53.9% | 36.6% |
| Interquartile 25% (IQ1) | 38.1% | 24.6% |
| Interquartile 75% (IQ3) | 64.9% | 44.5% |
| Interquartile Range (IQR) | 26.9% | 19.9% |
| Standard Deviation (Sample) | 19.2% | 11.8% |
| Standard Deviation (Population) | 19.1% | 11.7% |
Similar Demographics by Associate's Degree
Demographics Similar to Latvians by Associate's Degree
In terms of associate's degree, the demographic groups most similar to Latvians are Turkish (53.9%, a difference of 0.070%), Immigrants from France (53.9%, a difference of 0.090%), Immigrants from Sri Lanka (53.7%, a difference of 0.50%), Immigrants from Northern Europe (53.5%, a difference of 0.87%), and Immigrants from Turkey (53.4%, a difference of 0.90%).
| Demographics | Rating | Rank | Associate's Degree |
| Cambodians | 100.0 /100 | #20 | Exceptional 54.6% |
| Immigrants | Sweden | 100.0 /100 | #21 | Exceptional 54.6% |
| Immigrants | Japan | 100.0 /100 | #22 | Exceptional 54.6% |
| Burmese | 100.0 /100 | #23 | Exceptional 54.6% |
| Immigrants | Korea | 100.0 /100 | #24 | Exceptional 54.5% |
| Immigrants | Switzerland | 100.0 /100 | #25 | Exceptional 54.5% |
| Immigrants | Belgium | 100.0 /100 | #26 | Exceptional 54.5% |
| Latvians | 100.0 /100 | #27 | Exceptional 53.9% |
| Turks | 100.0 /100 | #28 | Exceptional 53.9% |
| Immigrants | France | 100.0 /100 | #29 | Exceptional 53.9% |
| Immigrants | Sri Lanka | 100.0 /100 | #30 | Exceptional 53.7% |
| Immigrants | Northern Europe | 100.0 /100 | #31 | Exceptional 53.5% |
| Immigrants | Turkey | 100.0 /100 | #32 | Exceptional 53.4% |
| Israelis | 100.0 /100 | #33 | Exceptional 53.4% |
| Bulgarians | 100.0 /100 | #34 | Exceptional 53.3% |
Demographics Similar to Immigrants from Portugal by Associate's Degree
In terms of associate's degree, the demographic groups most similar to Immigrants from Portugal are Immigrants from Micronesia (40.2%, a difference of 0.10%), Immigrants from Nicaragua (40.3%, a difference of 0.30%), Bangladeshi (40.0%, a difference of 0.31%), Ottawa (40.3%, a difference of 0.34%), and Haitian (40.0%, a difference of 0.46%).
| Demographics | Rating | Rank | Associate's Degree |
| Immigrants | Dominica | 0.1 /100 | #274 | Tragic 40.5% |
| Potawatomi | 0.1 /100 | #275 | Tragic 40.4% |
| Puerto Ricans | 0.1 /100 | #276 | Tragic 40.4% |
| Blackfeet | 0.1 /100 | #277 | Tragic 40.3% |
| Ottawa | 0.1 /100 | #278 | Tragic 40.3% |
| Immigrants | Nicaragua | 0.1 /100 | #279 | Tragic 40.3% |
| Immigrants | Micronesia | 0.1 /100 | #280 | Tragic 40.2% |
| Immigrants | Portugal | 0.1 /100 | #281 | Tragic 40.1% |
| Bangladeshis | 0.1 /100 | #282 | Tragic 40.0% |
| Haitians | 0.1 /100 | #283 | Tragic 40.0% |
| Comanche | 0.1 /100 | #284 | Tragic 39.9% |
| Immigrants | Belize | 0.1 /100 | #285 | Tragic 39.9% |
| Immigrants | Caribbean | 0.0 /100 | #286 | Tragic 39.7% |
| Aleuts | 0.0 /100 | #287 | Tragic 39.6% |
| Immigrants | Cuba | 0.0 /100 | #288 | Tragic 39.5% |