Korean vs Sierra Leonean 2nd Grade
COMPARE
Korean
Sierra Leonean
2nd Grade
2nd Grade Comparison
Koreans
Sierra Leoneans
97.5%
2ND GRADE
1.5/ 100
METRIC RATING
240th/ 347
METRIC RANK
97.6%
2ND GRADE
4.3/ 100
METRIC RATING
223rd/ 347
METRIC RANK
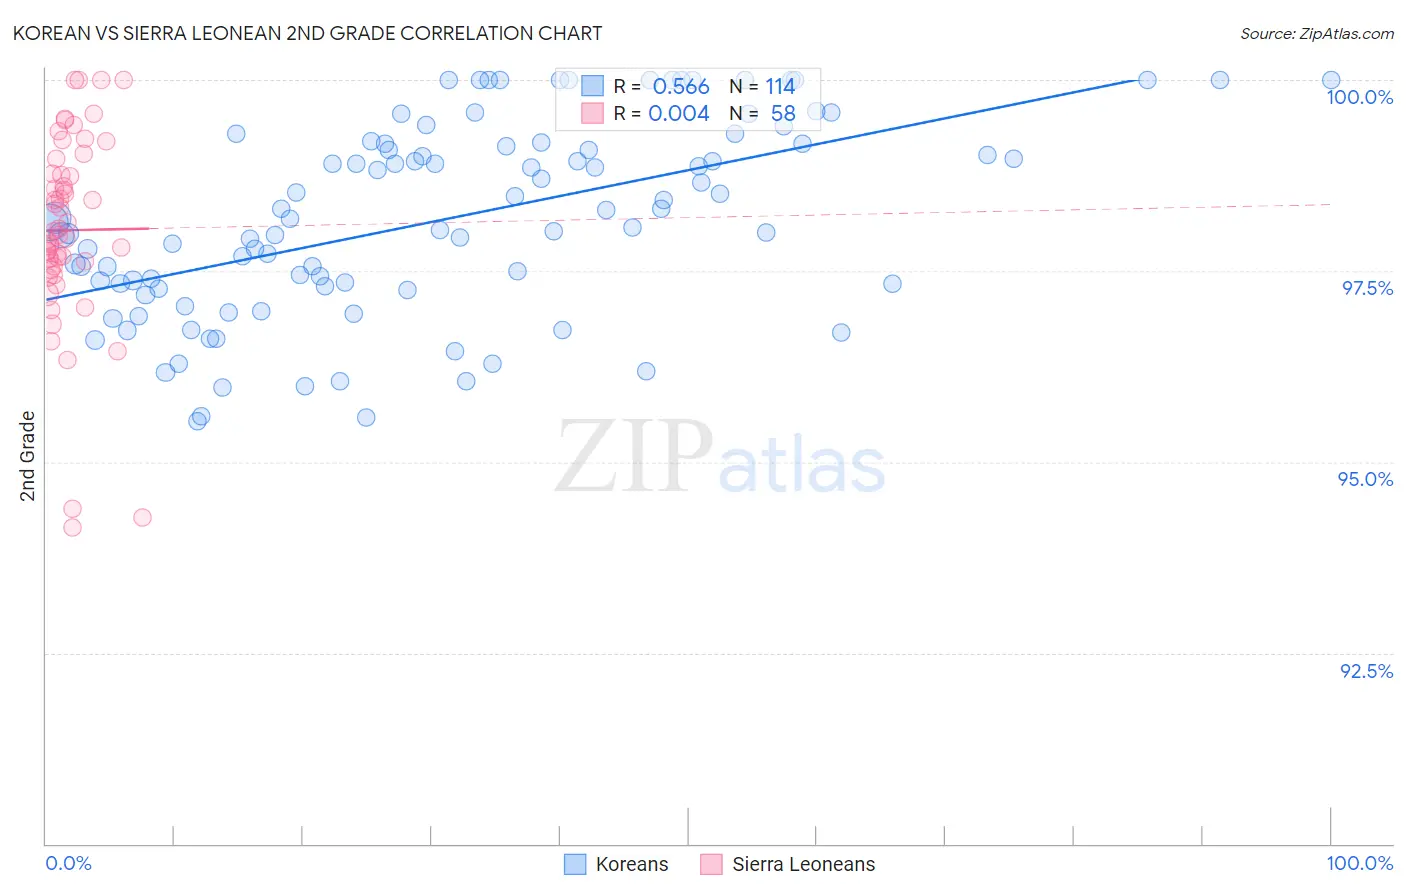
Korean vs Sierra Leonean 2nd Grade Correlation Chart
The statistical analysis conducted on geographies consisting of 510,935,951 people shows a substantial positive correlation between the proportion of Koreans and percentage of population with at least 2nd grade education in the United States with a correlation coefficient (R) of 0.566 and weighted average of 97.5%. Similarly, the statistical analysis conducted on geographies consisting of 83,337,655 people shows no correlation between the proportion of Sierra Leoneans and percentage of population with at least 2nd grade education in the United States with a correlation coefficient (R) of 0.004 and weighted average of 97.6%, a difference of 0.090%.
2nd Grade Correlation Summary
| Measurement | Korean | Sierra Leonean |
| Minimum | 95.5% | 94.1% |
| Maximum | 100.0% | 100.0% |
| Range | 4.5% | 5.9% |
| Mean | 98.2% | 98.0% |
| Median | 98.2% | 98.0% |
| Interquartile 25% (IQ1) | 97.3% | 97.6% |
| Interquartile 75% (IQ3) | 99.2% | 98.8% |
| Interquartile Range (IQR) | 1.9% | 1.2% |
| Standard Deviation (Sample) | 1.3% | 1.3% |
| Standard Deviation (Population) | 1.2% | 1.3% |
Demographics Similar to Koreans and Sierra Leoneans by 2nd Grade
In terms of 2nd grade, the demographic groups most similar to Koreans are Nigerian (97.6%, a difference of 0.010%), U.S. Virgin Islander (97.6%, a difference of 0.010%), Immigrants from Eastern Asia (97.6%, a difference of 0.010%), Liberian (97.6%, a difference of 0.010%), and Ethiopian (97.5%, a difference of 0.010%). Similarly, the demographic groups most similar to Sierra Leoneans are Immigrants from Sudan (97.6%, a difference of 0.0%), Immigrants from Zaire (97.6%, a difference of 0.0%), Tongan (97.6%, a difference of 0.0%), Iraqi (97.6%, a difference of 0.010%), and Immigrants from Syria (97.6%, a difference of 0.010%).
| Demographics | Rating | Rank | 2nd Grade |
| Iraqis | 4.6 /100 | #221 | Tragic 97.6% |
| Immigrants | Sudan | 4.5 /100 | #222 | Tragic 97.6% |
| Sierra Leoneans | 4.3 /100 | #223 | Tragic 97.6% |
| Immigrants | Zaire | 4.3 /100 | #224 | Tragic 97.6% |
| Tongans | 4.3 /100 | #225 | Tragic 97.6% |
| Immigrants | Syria | 4.0 /100 | #226 | Tragic 97.6% |
| Immigrants | Nepal | 4.0 /100 | #227 | Tragic 97.6% |
| Sub-Saharan Africans | 3.4 /100 | #228 | Tragic 97.6% |
| Immigrants | Costa Rica | 3.1 /100 | #229 | Tragic 97.6% |
| Senegalese | 3.1 /100 | #230 | Tragic 97.6% |
| Immigrants | Pakistan | 2.3 /100 | #231 | Tragic 97.6% |
| Immigrants | Western Asia | 2.1 /100 | #232 | Tragic 97.6% |
| Immigrants | Uruguay | 2.1 /100 | #233 | Tragic 97.6% |
| Immigrants | Malaysia | 2.0 /100 | #234 | Tragic 97.6% |
| Colombians | 1.9 /100 | #235 | Tragic 97.6% |
| Nigerians | 1.7 /100 | #236 | Tragic 97.6% |
| U.S. Virgin Islanders | 1.6 /100 | #237 | Tragic 97.6% |
| Immigrants | Eastern Asia | 1.6 /100 | #238 | Tragic 97.6% |
| Liberians | 1.6 /100 | #239 | Tragic 97.6% |
| Koreans | 1.5 /100 | #240 | Tragic 97.5% |
| Ethiopians | 1.2 /100 | #241 | Tragic 97.5% |