Chippewa vs Trinidadian and Tobagonian 2nd Grade
COMPARE
Chippewa
Trinidadian and Tobagonian
2nd Grade
2nd Grade Comparison
Chippewa
Trinidadians and Tobagonians
98.4%
2ND GRADE
99.9/ 100
METRIC RATING
39th/ 347
METRIC RANK
97.3%
2ND GRADE
0.1/ 100
METRIC RATING
281st/ 347
METRIC RANK
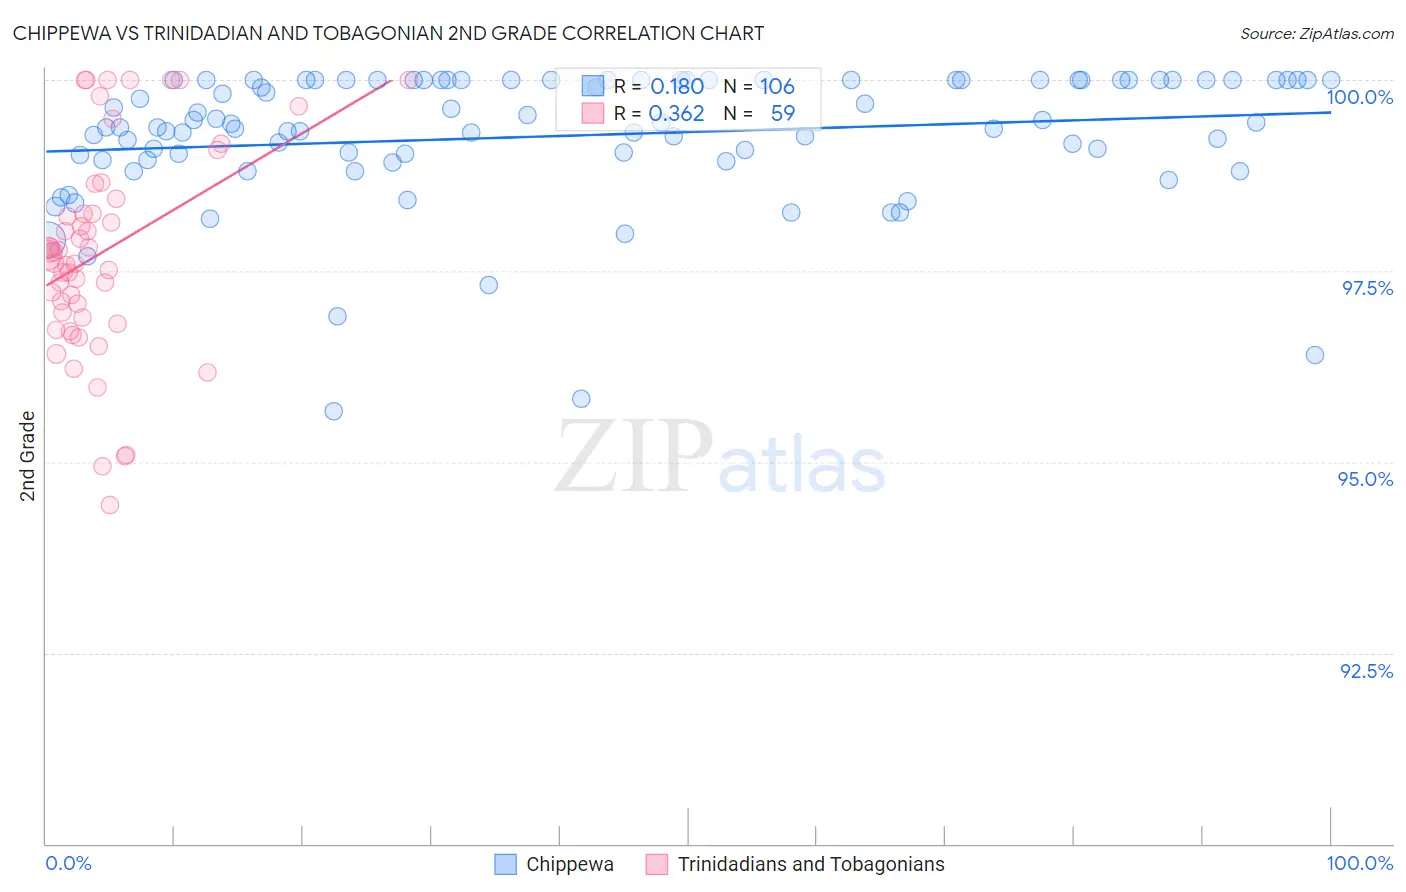
Chippewa vs Trinidadian and Tobagonian 2nd Grade Correlation Chart
The statistical analysis conducted on geographies consisting of 215,065,644 people shows a poor positive correlation between the proportion of Chippewa and percentage of population with at least 2nd grade education in the United States with a correlation coefficient (R) of 0.180 and weighted average of 98.4%. Similarly, the statistical analysis conducted on geographies consisting of 219,882,819 people shows a mild positive correlation between the proportion of Trinidadians and Tobagonians and percentage of population with at least 2nd grade education in the United States with a correlation coefficient (R) of 0.362 and weighted average of 97.3%, a difference of 1.2%.
2nd Grade Correlation Summary
| Measurement | Chippewa | Trinidadian and Tobagonian |
| Minimum | 95.7% | 94.4% |
| Maximum | 100.0% | 100.0% |
| Range | 4.3% | 5.6% |
| Mean | 99.3% | 97.7% |
| Median | 99.4% | 97.7% |
| Interquartile 25% (IQ1) | 99.0% | 96.9% |
| Interquartile 75% (IQ3) | 100.0% | 98.4% |
| Interquartile Range (IQR) | 1.0% | 1.6% |
| Standard Deviation (Sample) | 0.88% | 1.4% |
| Standard Deviation (Population) | 0.88% | 1.3% |
Similar Demographics by 2nd Grade
Demographics Similar to Chippewa by 2nd Grade
In terms of 2nd grade, the demographic groups most similar to Chippewa are Latvian (98.4%, a difference of 0.0%), Italian (98.4%, a difference of 0.010%), Luxembourger (98.4%, a difference of 0.010%), Eastern European (98.4%, a difference of 0.010%), and Native Hawaiian (98.4%, a difference of 0.020%).
| Demographics | Rating | Rank | 2nd Grade |
| French Canadians | 100.0 /100 | #32 | Exceptional 98.5% |
| Scandinavians | 100.0 /100 | #33 | Exceptional 98.5% |
| Chinese | 100.0 /100 | #34 | Exceptional 98.5% |
| Swiss | 100.0 /100 | #35 | Exceptional 98.5% |
| British | 100.0 /100 | #36 | Exceptional 98.5% |
| Italians | 99.9 /100 | #37 | Exceptional 98.4% |
| Latvians | 99.9 /100 | #38 | Exceptional 98.4% |
| Chippewa | 99.9 /100 | #39 | Exceptional 98.4% |
| Luxembourgers | 99.9 /100 | #40 | Exceptional 98.4% |
| Eastern Europeans | 99.9 /100 | #41 | Exceptional 98.4% |
| Native Hawaiians | 99.9 /100 | #42 | Exceptional 98.4% |
| Belgians | 99.9 /100 | #43 | Exceptional 98.4% |
| Northern Europeans | 99.9 /100 | #44 | Exceptional 98.4% |
| Hungarians | 99.9 /100 | #45 | Exceptional 98.4% |
| Lumbee | 99.9 /100 | #46 | Exceptional 98.4% |
Demographics Similar to Trinidadians and Tobagonians by 2nd Grade
In terms of 2nd grade, the demographic groups most similar to Trinidadians and Tobagonians are Afghan (97.3%, a difference of 0.0%), Immigrants from Ghana (97.3%, a difference of 0.010%), Barbadian (97.3%, a difference of 0.010%), Immigrants from Uzbekistan (97.3%, a difference of 0.020%), and Immigrants from Philippines (97.3%, a difference of 0.030%).
| Demographics | Rating | Rank | 2nd Grade |
| Ghanaians | 0.1 /100 | #274 | Tragic 97.4% |
| Immigrants | China | 0.1 /100 | #275 | Tragic 97.3% |
| Immigrants | Philippines | 0.1 /100 | #276 | Tragic 97.3% |
| Immigrants | Western Africa | 0.1 /100 | #277 | Tragic 97.3% |
| Immigrants | Uzbekistan | 0.1 /100 | #278 | Tragic 97.3% |
| Immigrants | Ghana | 0.1 /100 | #279 | Tragic 97.3% |
| Afghans | 0.1 /100 | #280 | Tragic 97.3% |
| Trinidadians and Tobagonians | 0.1 /100 | #281 | Tragic 97.3% |
| Barbadians | 0.1 /100 | #282 | Tragic 97.3% |
| Immigrants | Trinidad and Tobago | 0.0 /100 | #283 | Tragic 97.2% |
| Immigrants | West Indies | 0.0 /100 | #284 | Tragic 97.2% |
| Immigrants | Hong Kong | 0.0 /100 | #285 | Tragic 97.2% |
| Immigrants | Barbados | 0.0 /100 | #286 | Tragic 97.2% |
| Immigrants | Portugal | 0.0 /100 | #287 | Tragic 97.2% |
| Immigrants | Thailand | 0.0 /100 | #288 | Tragic 97.2% |