Korean vs Albanian 2nd Grade
COMPARE
Korean
Albanian
2nd Grade
2nd Grade Comparison
Koreans
Albanians
97.5%
2ND GRADE
1.5/ 100
METRIC RATING
240th/ 347
METRIC RANK
97.9%
2ND GRADE
52.8/ 100
METRIC RATING
171st/ 347
METRIC RANK
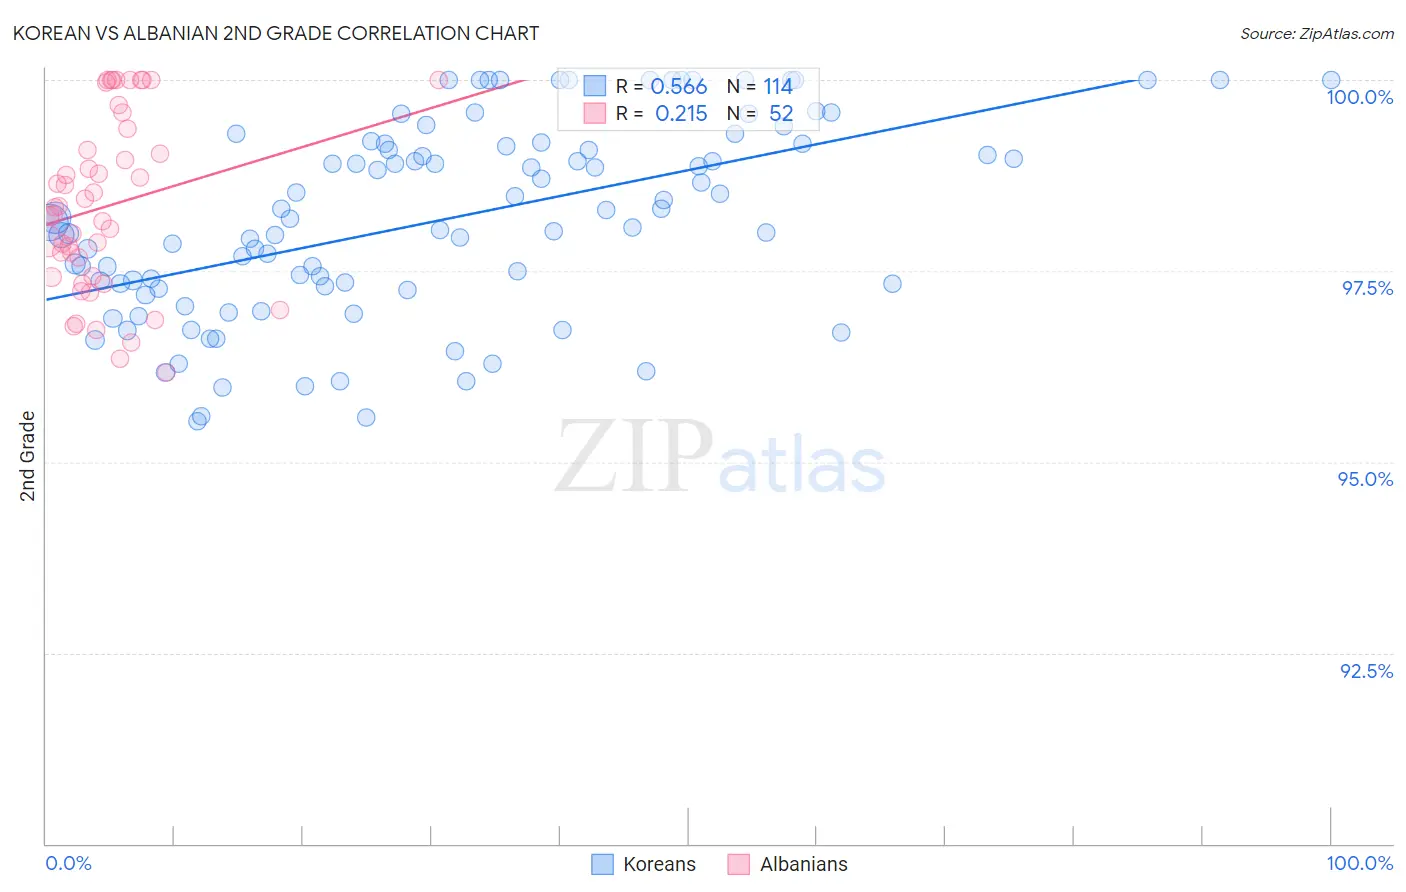
Korean vs Albanian 2nd Grade Correlation Chart
The statistical analysis conducted on geographies consisting of 510,935,951 people shows a substantial positive correlation between the proportion of Koreans and percentage of population with at least 2nd grade education in the United States with a correlation coefficient (R) of 0.566 and weighted average of 97.5%. Similarly, the statistical analysis conducted on geographies consisting of 193,265,850 people shows a weak positive correlation between the proportion of Albanians and percentage of population with at least 2nd grade education in the United States with a correlation coefficient (R) of 0.215 and weighted average of 97.9%, a difference of 0.34%.
2nd Grade Correlation Summary
| Measurement | Korean | Albanian |
| Minimum | 95.5% | 96.2% |
| Maximum | 100.0% | 100.0% |
| Range | 4.5% | 3.8% |
| Mean | 98.2% | 98.3% |
| Median | 98.2% | 98.3% |
| Interquartile 25% (IQ1) | 97.3% | 97.4% |
| Interquartile 75% (IQ3) | 99.2% | 99.2% |
| Interquartile Range (IQR) | 1.9% | 1.8% |
| Standard Deviation (Sample) | 1.3% | 1.1% |
| Standard Deviation (Population) | 1.2% | 1.1% |
Similar Demographics by 2nd Grade
Demographics Similar to Koreans by 2nd Grade
In terms of 2nd grade, the demographic groups most similar to Koreans are Nigerian (97.6%, a difference of 0.010%), U.S. Virgin Islander (97.6%, a difference of 0.010%), Immigrants from Eastern Asia (97.6%, a difference of 0.010%), Liberian (97.6%, a difference of 0.010%), and Ethiopian (97.5%, a difference of 0.010%).
| Demographics | Rating | Rank | 2nd Grade |
| Immigrants | Uruguay | 2.1 /100 | #233 | Tragic 97.6% |
| Immigrants | Malaysia | 2.0 /100 | #234 | Tragic 97.6% |
| Colombians | 1.9 /100 | #235 | Tragic 97.6% |
| Nigerians | 1.7 /100 | #236 | Tragic 97.6% |
| U.S. Virgin Islanders | 1.6 /100 | #237 | Tragic 97.6% |
| Immigrants | Eastern Asia | 1.6 /100 | #238 | Tragic 97.6% |
| Liberians | 1.6 /100 | #239 | Tragic 97.6% |
| Koreans | 1.5 /100 | #240 | Tragic 97.5% |
| Ethiopians | 1.2 /100 | #241 | Tragic 97.5% |
| Immigrants | Indonesia | 1.2 /100 | #242 | Tragic 97.5% |
| Asians | 1.1 /100 | #243 | Tragic 97.5% |
| Immigrants | Iraq | 1.0 /100 | #244 | Tragic 97.5% |
| Immigrants | Eastern Africa | 0.9 /100 | #245 | Tragic 97.5% |
| South Americans | 0.9 /100 | #246 | Tragic 97.5% |
| Immigrants | Senegal | 0.9 /100 | #247 | Tragic 97.5% |
Demographics Similar to Albanians by 2nd Grade
In terms of 2nd grade, the demographic groups most similar to Albanians are Navajo (97.9%, a difference of 0.0%), Immigrants from Korea (97.9%, a difference of 0.0%), Kenyan (97.9%, a difference of 0.0%), Ugandan (97.9%, a difference of 0.010%), and Spanish American (97.9%, a difference of 0.010%).
| Demographics | Rating | Rank | 2nd Grade |
| Ugandans | 56.6 /100 | #164 | Average 97.9% |
| Spanish Americans | 56.4 /100 | #165 | Average 97.9% |
| Immigrants | Jordan | 56.3 /100 | #166 | Average 97.9% |
| Chileans | 56.1 /100 | #167 | Average 97.9% |
| Brazilians | 55.8 /100 | #168 | Average 97.9% |
| Immigrants | Spain | 55.4 /100 | #169 | Average 97.9% |
| Navajo | 54.3 /100 | #170 | Average 97.9% |
| Albanians | 52.8 /100 | #171 | Average 97.9% |
| Immigrants | Korea | 52.7 /100 | #172 | Average 97.9% |
| Kenyans | 52.7 /100 | #173 | Average 97.9% |
| Immigrants | Micronesia | 50.0 /100 | #174 | Average 97.9% |
| Immigrants | Bosnia and Herzegovina | 49.8 /100 | #175 | Average 97.9% |
| Immigrants | Sri Lanka | 48.7 /100 | #176 | Average 97.9% |
| Immigrants | Brazil | 46.6 /100 | #177 | Average 97.9% |
| Argentineans | 46.3 /100 | #178 | Average 97.9% |