Central American vs Trinidadian and Tobagonian 2nd Grade
COMPARE
Central American
Trinidadian and Tobagonian
2nd Grade
2nd Grade Comparison
Central Americans
Trinidadians and Tobagonians
96.4%
2ND GRADE
0.0/ 100
METRIC RATING
334th/ 347
METRIC RANK
97.3%
2ND GRADE
0.1/ 100
METRIC RATING
281st/ 347
METRIC RANK
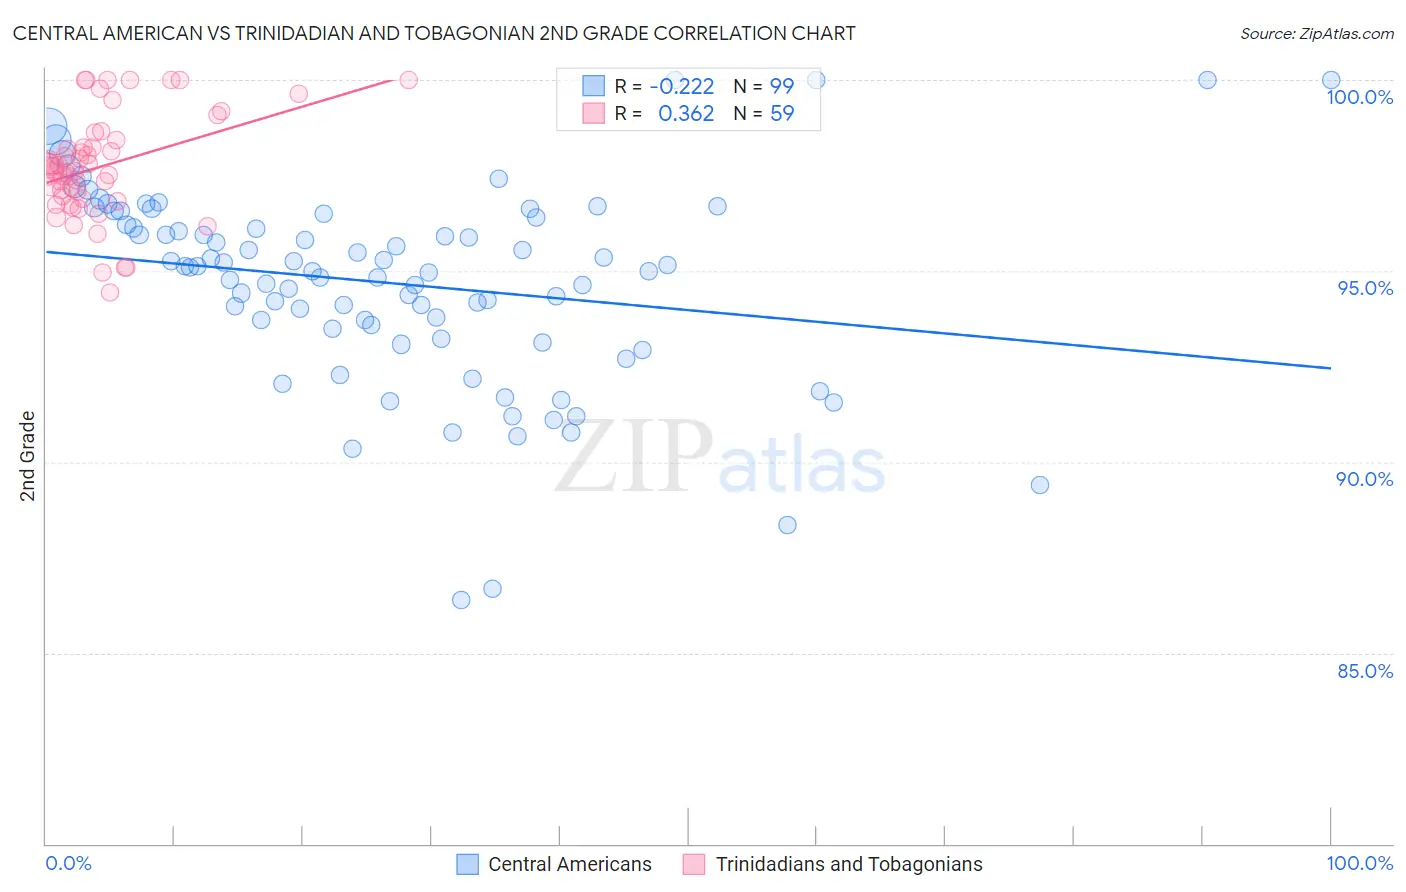
Central American vs Trinidadian and Tobagonian 2nd Grade Correlation Chart
The statistical analysis conducted on geographies consisting of 504,619,275 people shows a weak negative correlation between the proportion of Central Americans and percentage of population with at least 2nd grade education in the United States with a correlation coefficient (R) of -0.222 and weighted average of 96.4%. Similarly, the statistical analysis conducted on geographies consisting of 219,882,819 people shows a mild positive correlation between the proportion of Trinidadians and Tobagonians and percentage of population with at least 2nd grade education in the United States with a correlation coefficient (R) of 0.362 and weighted average of 97.3%, a difference of 0.93%.
2nd Grade Correlation Summary
| Measurement | Central American | Trinidadian and Tobagonian |
| Minimum | 86.4% | 94.4% |
| Maximum | 100.0% | 100.0% |
| Range | 13.6% | 5.6% |
| Mean | 94.7% | 97.7% |
| Median | 95.1% | 97.7% |
| Interquartile 25% (IQ1) | 93.5% | 96.9% |
| Interquartile 75% (IQ3) | 96.4% | 98.4% |
| Interquartile Range (IQR) | 2.9% | 1.6% |
| Standard Deviation (Sample) | 2.6% | 1.4% |
| Standard Deviation (Population) | 2.6% | 1.3% |
Similar Demographics by 2nd Grade
Demographics Similar to Central Americans by 2nd Grade
In terms of 2nd grade, the demographic groups most similar to Central Americans are Yakama (96.4%, a difference of 0.010%), Immigrants from Dominican Republic (96.4%, a difference of 0.020%), Immigrants from Fiji (96.4%, a difference of 0.020%), Immigrants from Cambodia (96.4%, a difference of 0.030%), and Immigrants from Cabo Verde (96.3%, a difference of 0.050%).
| Demographics | Rating | Rank | 2nd Grade |
| Immigrants | Vietnam | 0.0 /100 | #327 | Tragic 96.5% |
| Mexicans | 0.0 /100 | #328 | Tragic 96.5% |
| Japanese | 0.0 /100 | #329 | Tragic 96.5% |
| Immigrants | Latin America | 0.0 /100 | #330 | Tragic 96.5% |
| Immigrants | Armenia | 0.0 /100 | #331 | Tragic 96.5% |
| Bangladeshis | 0.0 /100 | #332 | Tragic 96.5% |
| Immigrants | Dominican Republic | 0.0 /100 | #333 | Tragic 96.4% |
| Central Americans | 0.0 /100 | #334 | Tragic 96.4% |
| Yakama | 0.0 /100 | #335 | Tragic 96.4% |
| Immigrants | Fiji | 0.0 /100 | #336 | Tragic 96.4% |
| Immigrants | Cambodia | 0.0 /100 | #337 | Tragic 96.4% |
| Immigrants | Cabo Verde | 0.0 /100 | #338 | Tragic 96.3% |
| Guatemalans | 0.0 /100 | #339 | Tragic 96.3% |
| Immigrants | Guatemala | 0.0 /100 | #340 | Tragic 96.2% |
| Immigrants | Central America | 0.0 /100 | #341 | Tragic 96.2% |
Demographics Similar to Trinidadians and Tobagonians by 2nd Grade
In terms of 2nd grade, the demographic groups most similar to Trinidadians and Tobagonians are Afghan (97.3%, a difference of 0.0%), Immigrants from Ghana (97.3%, a difference of 0.010%), Barbadian (97.3%, a difference of 0.010%), Immigrants from Uzbekistan (97.3%, a difference of 0.020%), and Immigrants from Philippines (97.3%, a difference of 0.030%).
| Demographics | Rating | Rank | 2nd Grade |
| Ghanaians | 0.1 /100 | #274 | Tragic 97.4% |
| Immigrants | China | 0.1 /100 | #275 | Tragic 97.3% |
| Immigrants | Philippines | 0.1 /100 | #276 | Tragic 97.3% |
| Immigrants | Western Africa | 0.1 /100 | #277 | Tragic 97.3% |
| Immigrants | Uzbekistan | 0.1 /100 | #278 | Tragic 97.3% |
| Immigrants | Ghana | 0.1 /100 | #279 | Tragic 97.3% |
| Afghans | 0.1 /100 | #280 | Tragic 97.3% |
| Trinidadians and Tobagonians | 0.1 /100 | #281 | Tragic 97.3% |
| Barbadians | 0.1 /100 | #282 | Tragic 97.3% |
| Immigrants | Trinidad and Tobago | 0.0 /100 | #283 | Tragic 97.2% |
| Immigrants | West Indies | 0.0 /100 | #284 | Tragic 97.2% |
| Immigrants | Hong Kong | 0.0 /100 | #285 | Tragic 97.2% |
| Immigrants | Barbados | 0.0 /100 | #286 | Tragic 97.2% |
| Immigrants | Portugal | 0.0 /100 | #287 | Tragic 97.2% |
| Immigrants | Thailand | 0.0 /100 | #288 | Tragic 97.2% |