Korean vs Arab 2nd Grade
COMPARE
Korean
Arab
2nd Grade
2nd Grade Comparison
Koreans
Arabs
97.5%
2ND GRADE
1.5/ 100
METRIC RATING
240th/ 347
METRIC RANK
97.8%
2ND GRADE
36.9/ 100
METRIC RATING
186th/ 347
METRIC RANK
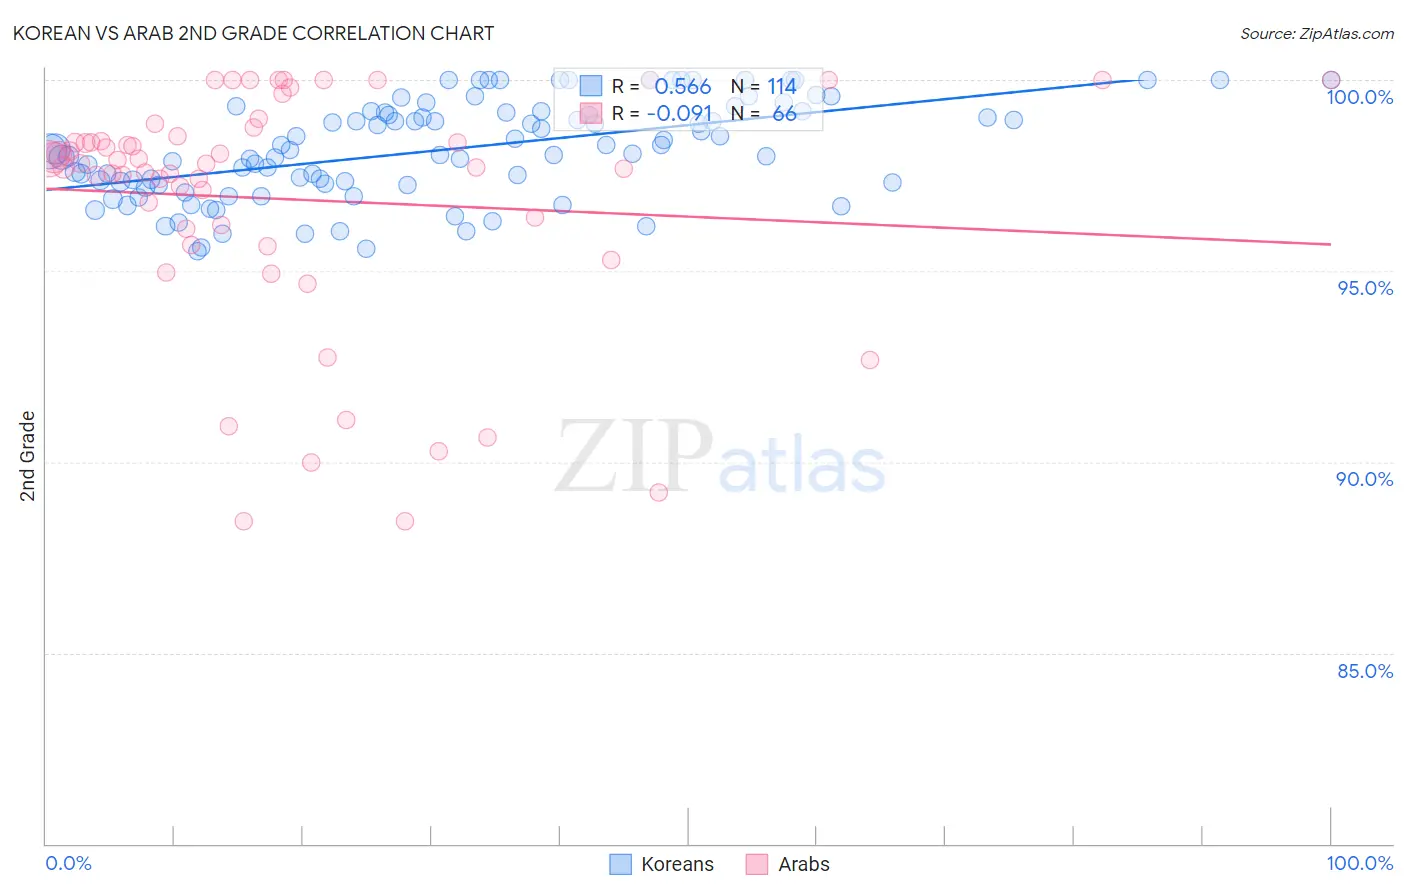
Korean vs Arab 2nd Grade Correlation Chart
The statistical analysis conducted on geographies consisting of 510,935,951 people shows a substantial positive correlation between the proportion of Koreans and percentage of population with at least 2nd grade education in the United States with a correlation coefficient (R) of 0.566 and weighted average of 97.5%. Similarly, the statistical analysis conducted on geographies consisting of 486,872,222 people shows a slight negative correlation between the proportion of Arabs and percentage of population with at least 2nd grade education in the United States with a correlation coefficient (R) of -0.091 and weighted average of 97.8%, a difference of 0.29%.
2nd Grade Correlation Summary
| Measurement | Korean | Arab |
| Minimum | 95.5% | 88.4% |
| Maximum | 100.0% | 100.0% |
| Range | 4.5% | 11.6% |
| Mean | 98.2% | 96.9% |
| Median | 98.2% | 97.8% |
| Interquartile 25% (IQ1) | 97.3% | 96.1% |
| Interquartile 75% (IQ3) | 99.2% | 98.5% |
| Interquartile Range (IQR) | 1.9% | 2.4% |
| Standard Deviation (Sample) | 1.3% | 3.1% |
| Standard Deviation (Population) | 1.2% | 3.1% |
Similar Demographics by 2nd Grade
Demographics Similar to Koreans by 2nd Grade
In terms of 2nd grade, the demographic groups most similar to Koreans are Nigerian (97.6%, a difference of 0.010%), U.S. Virgin Islander (97.6%, a difference of 0.010%), Immigrants from Eastern Asia (97.6%, a difference of 0.010%), Liberian (97.6%, a difference of 0.010%), and Ethiopian (97.5%, a difference of 0.010%).
| Demographics | Rating | Rank | 2nd Grade |
| Immigrants | Uruguay | 2.1 /100 | #233 | Tragic 97.6% |
| Immigrants | Malaysia | 2.0 /100 | #234 | Tragic 97.6% |
| Colombians | 1.9 /100 | #235 | Tragic 97.6% |
| Nigerians | 1.7 /100 | #236 | Tragic 97.6% |
| U.S. Virgin Islanders | 1.6 /100 | #237 | Tragic 97.6% |
| Immigrants | Eastern Asia | 1.6 /100 | #238 | Tragic 97.6% |
| Liberians | 1.6 /100 | #239 | Tragic 97.6% |
| Koreans | 1.5 /100 | #240 | Tragic 97.5% |
| Ethiopians | 1.2 /100 | #241 | Tragic 97.5% |
| Immigrants | Indonesia | 1.2 /100 | #242 | Tragic 97.5% |
| Asians | 1.1 /100 | #243 | Tragic 97.5% |
| Immigrants | Iraq | 1.0 /100 | #244 | Tragic 97.5% |
| Immigrants | Eastern Africa | 0.9 /100 | #245 | Tragic 97.5% |
| South Americans | 0.9 /100 | #246 | Tragic 97.5% |
| Immigrants | Senegal | 0.9 /100 | #247 | Tragic 97.5% |
Demographics Similar to Arabs by 2nd Grade
In terms of 2nd grade, the demographic groups most similar to Arabs are Pakistani (97.8%, a difference of 0.0%), Immigrants from Kazakhstan (97.8%, a difference of 0.0%), Immigrants from Argentina (97.8%, a difference of 0.010%), Panamanian (97.8%, a difference of 0.010%), and Native/Alaskan (97.9%, a difference of 0.020%).
| Demographics | Rating | Rank | 2nd Grade |
| Immigrants | Venezuela | 46.1 /100 | #179 | Average 97.9% |
| Natives/Alaskans | 44.3 /100 | #180 | Average 97.9% |
| Egyptians | 44.3 /100 | #181 | Average 97.9% |
| Portuguese | 42.4 /100 | #182 | Average 97.8% |
| Immigrants | Poland | 42.2 /100 | #183 | Average 97.8% |
| Immigrants | Belarus | 41.5 /100 | #184 | Average 97.8% |
| Immigrants | Argentina | 40.6 /100 | #185 | Average 97.8% |
| Arabs | 36.9 /100 | #186 | Fair 97.8% |
| Pakistanis | 36.1 /100 | #187 | Fair 97.8% |
| Immigrants | Kazakhstan | 35.6 /100 | #188 | Fair 97.8% |
| Panamanians | 33.5 /100 | #189 | Fair 97.8% |
| Immigrants | Taiwan | 31.8 /100 | #190 | Fair 97.8% |
| Paraguayans | 30.8 /100 | #191 | Fair 97.8% |
| Blacks/African Americans | 29.9 /100 | #192 | Fair 97.8% |
| Hawaiians | 28.5 /100 | #193 | Fair 97.8% |