Korean vs Immigrants from Latvia 2nd Grade
COMPARE
Korean
Immigrants from Latvia
2nd Grade
2nd Grade Comparison
Koreans
Immigrants from Latvia
97.5%
2ND GRADE
1.5/ 100
METRIC RATING
240th/ 347
METRIC RANK
98.1%
2ND GRADE
96.4/ 100
METRIC RATING
114th/ 347
METRIC RANK
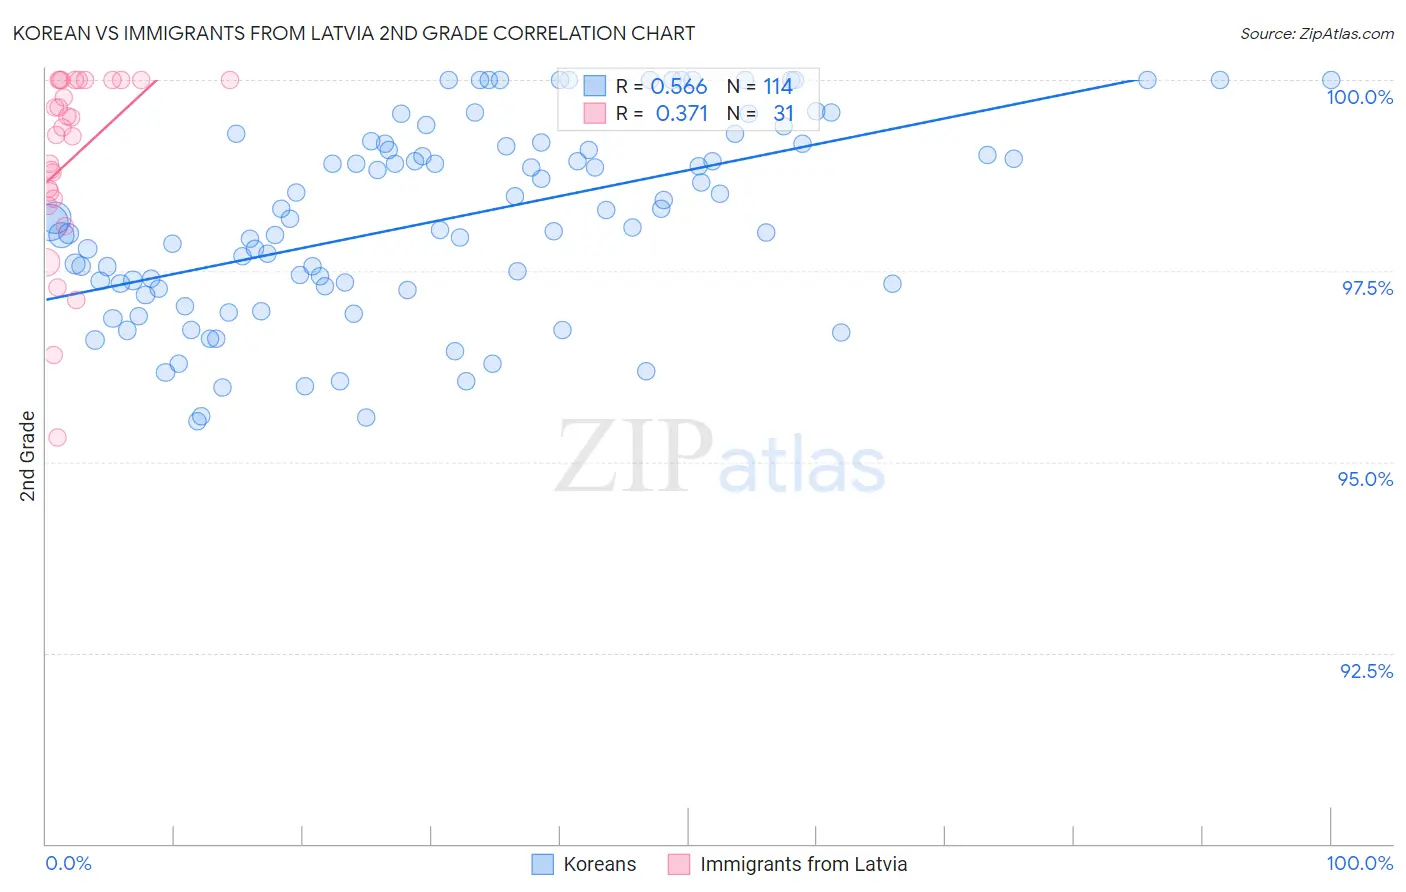
Korean vs Immigrants from Latvia 2nd Grade Correlation Chart
The statistical analysis conducted on geographies consisting of 510,935,951 people shows a substantial positive correlation between the proportion of Koreans and percentage of population with at least 2nd grade education in the United States with a correlation coefficient (R) of 0.566 and weighted average of 97.5%. Similarly, the statistical analysis conducted on geographies consisting of 113,735,345 people shows a mild positive correlation between the proportion of Immigrants from Latvia and percentage of population with at least 2nd grade education in the United States with a correlation coefficient (R) of 0.371 and weighted average of 98.1%, a difference of 0.59%.
2nd Grade Correlation Summary
| Measurement | Korean | Immigrants from Latvia |
| Minimum | 95.5% | 95.3% |
| Maximum | 100.0% | 100.0% |
| Range | 4.5% | 4.7% |
| Mean | 98.2% | 99.0% |
| Median | 98.2% | 99.4% |
| Interquartile 25% (IQ1) | 97.3% | 98.4% |
| Interquartile 75% (IQ3) | 99.2% | 100.0% |
| Interquartile Range (IQR) | 1.9% | 1.6% |
| Standard Deviation (Sample) | 1.3% | 1.2% |
| Standard Deviation (Population) | 1.2% | 1.2% |
Similar Demographics by 2nd Grade
Demographics Similar to Koreans by 2nd Grade
In terms of 2nd grade, the demographic groups most similar to Koreans are Nigerian (97.6%, a difference of 0.010%), U.S. Virgin Islander (97.6%, a difference of 0.010%), Immigrants from Eastern Asia (97.6%, a difference of 0.010%), Liberian (97.6%, a difference of 0.010%), and Ethiopian (97.5%, a difference of 0.010%).
| Demographics | Rating | Rank | 2nd Grade |
| Immigrants | Uruguay | 2.1 /100 | #233 | Tragic 97.6% |
| Immigrants | Malaysia | 2.0 /100 | #234 | Tragic 97.6% |
| Colombians | 1.9 /100 | #235 | Tragic 97.6% |
| Nigerians | 1.7 /100 | #236 | Tragic 97.6% |
| U.S. Virgin Islanders | 1.6 /100 | #237 | Tragic 97.6% |
| Immigrants | Eastern Asia | 1.6 /100 | #238 | Tragic 97.6% |
| Liberians | 1.6 /100 | #239 | Tragic 97.6% |
| Koreans | 1.5 /100 | #240 | Tragic 97.5% |
| Ethiopians | 1.2 /100 | #241 | Tragic 97.5% |
| Immigrants | Indonesia | 1.2 /100 | #242 | Tragic 97.5% |
| Asians | 1.1 /100 | #243 | Tragic 97.5% |
| Immigrants | Iraq | 1.0 /100 | #244 | Tragic 97.5% |
| Immigrants | Eastern Africa | 0.9 /100 | #245 | Tragic 97.5% |
| South Americans | 0.9 /100 | #246 | Tragic 97.5% |
| Immigrants | Senegal | 0.9 /100 | #247 | Tragic 97.5% |
Demographics Similar to Immigrants from Latvia by 2nd Grade
In terms of 2nd grade, the demographic groups most similar to Immigrants from Latvia are Immigrants from Norway (98.1%, a difference of 0.0%), Immigrants from Singapore (98.1%, a difference of 0.010%), Immigrants from Czechoslovakia (98.1%, a difference of 0.010%), Colville (98.1%, a difference of 0.010%), and Iranian (98.1%, a difference of 0.010%).
| Demographics | Rating | Rank | 2nd Grade |
| German Russians | 97.4 /100 | #107 | Exceptional 98.1% |
| Immigrants | Switzerland | 97.3 /100 | #108 | Exceptional 98.1% |
| Basques | 97.2 /100 | #109 | Exceptional 98.1% |
| Immigrants | Singapore | 97.0 /100 | #110 | Exceptional 98.1% |
| Immigrants | Czechoslovakia | 96.9 /100 | #111 | Exceptional 98.1% |
| Colville | 96.6 /100 | #112 | Exceptional 98.1% |
| Immigrants | Norway | 96.5 /100 | #113 | Exceptional 98.1% |
| Immigrants | Latvia | 96.4 /100 | #114 | Exceptional 98.1% |
| Iranians | 95.9 /100 | #115 | Exceptional 98.1% |
| Spanish | 95.8 /100 | #116 | Exceptional 98.1% |
| Ute | 95.7 /100 | #117 | Exceptional 98.1% |
| Immigrants | France | 95.6 /100 | #118 | Exceptional 98.1% |
| Thais | 95.3 /100 | #119 | Exceptional 98.1% |
| Okinawans | 94.9 /100 | #120 | Exceptional 98.1% |
| Immigrants | Zimbabwe | 94.4 /100 | #121 | Exceptional 98.1% |