Kenyan vs Immigrants from Guyana Bachelor's Degree
COMPARE
Kenyan
Immigrants from Guyana
Bachelor's Degree
Bachelor's Degree Comparison
Kenyans
Immigrants from Guyana
38.7%
BACHELOR'S DEGREE
72.5/ 100
METRIC RATING
156th/ 347
METRIC RANK
33.9%
BACHELOR'S DEGREE
1.4/ 100
METRIC RATING
243rd/ 347
METRIC RANK
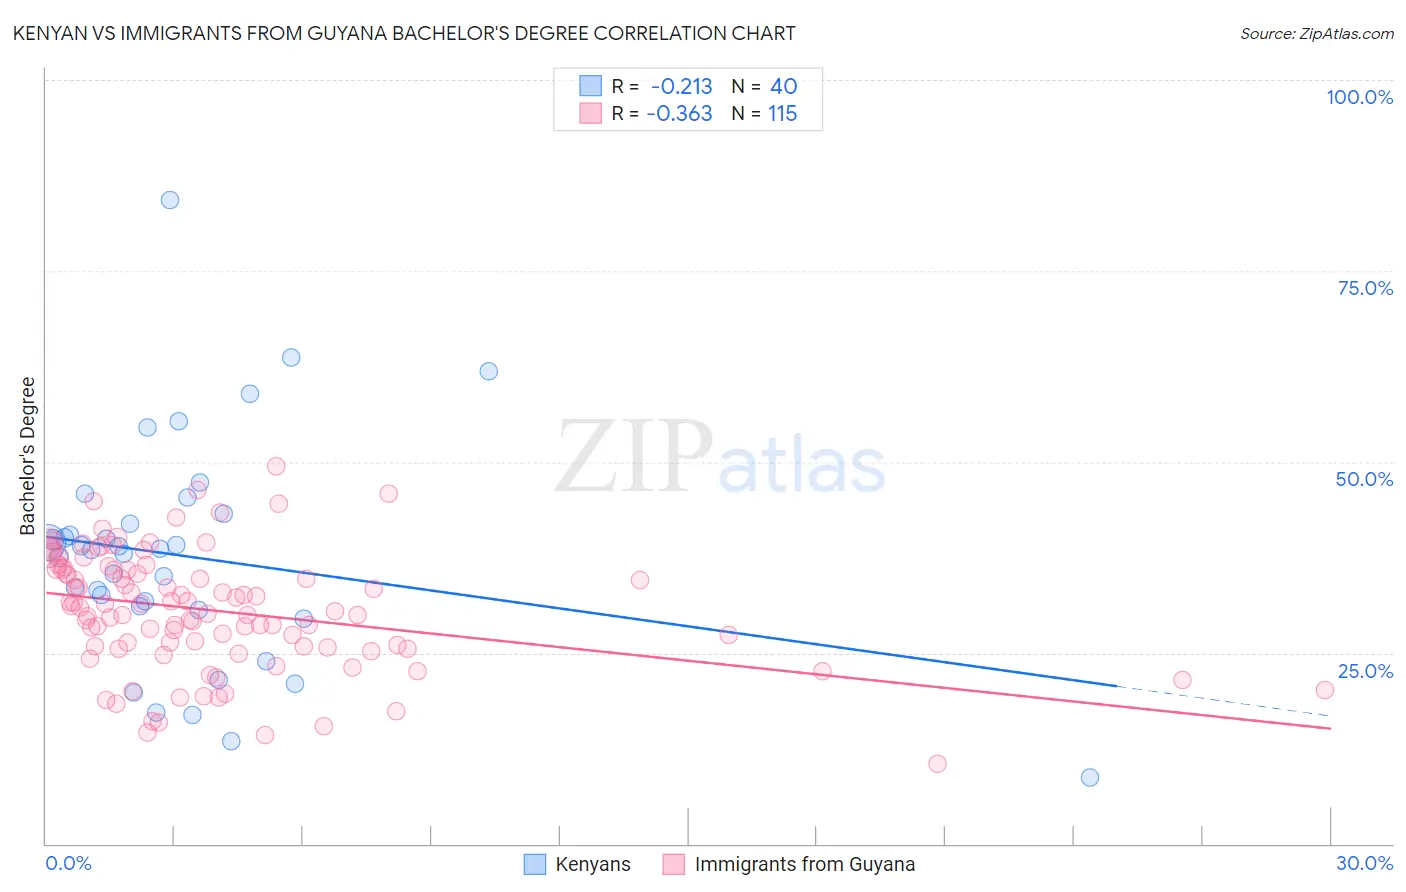
Kenyan vs Immigrants from Guyana Bachelor's Degree Correlation Chart
The statistical analysis conducted on geographies consisting of 168,237,785 people shows a weak negative correlation between the proportion of Kenyans and percentage of population with at least bachelor's degree education in the United States with a correlation coefficient (R) of -0.213 and weighted average of 38.7%. Similarly, the statistical analysis conducted on geographies consisting of 183,738,689 people shows a mild negative correlation between the proportion of Immigrants from Guyana and percentage of population with at least bachelor's degree education in the United States with a correlation coefficient (R) of -0.363 and weighted average of 33.9%, a difference of 14.1%.
Bachelor's Degree Correlation Summary
| Measurement | Kenyan | Immigrants from Guyana |
| Minimum | 8.7% | 10.5% |
| Maximum | 84.3% | 49.4% |
| Range | 75.6% | 38.9% |
| Mean | 37.6% | 30.5% |
| Median | 38.6% | 31.0% |
| Interquartile 25% (IQ1) | 30.8% | 25.6% |
| Interquartile 75% (IQ3) | 42.5% | 36.0% |
| Interquartile Range (IQR) | 11.7% | 10.3% |
| Standard Deviation (Sample) | 14.7% | 7.7% |
| Standard Deviation (Population) | 14.5% | 7.7% |
Similar Demographics by Bachelor's Degree
Demographics Similar to Kenyans by Bachelor's Degree
In terms of bachelor's degree, the demographic groups most similar to Kenyans are Immigrants from Kenya (38.8%, a difference of 0.15%), Immigrants from South America (38.6%, a difference of 0.28%), Canadian (38.8%, a difference of 0.31%), Immigrants from Germany (38.6%, a difference of 0.34%), and Slavic (38.9%, a difference of 0.42%).
| Demographics | Rating | Rank | Bachelor's Degree |
| Immigrants | Poland | 77.5 /100 | #149 | Good 39.0% |
| South Americans | 77.3 /100 | #150 | Good 38.9% |
| Immigrants | Africa | 76.5 /100 | #151 | Good 38.9% |
| Sudanese | 76.4 /100 | #152 | Good 38.9% |
| Slavs | 75.9 /100 | #153 | Good 38.9% |
| Canadians | 75.0 /100 | #154 | Good 38.8% |
| Immigrants | Kenya | 73.8 /100 | #155 | Good 38.8% |
| Kenyans | 72.5 /100 | #156 | Good 38.7% |
| Immigrants | South America | 70.1 /100 | #157 | Good 38.6% |
| Immigrants | Germany | 69.6 /100 | #158 | Good 38.6% |
| Chinese | 66.6 /100 | #159 | Good 38.5% |
| Vietnamese | 66.6 /100 | #160 | Good 38.5% |
| Uruguayans | 65.8 /100 | #161 | Good 38.4% |
| Colombians | 65.0 /100 | #162 | Good 38.4% |
| Peruvians | 63.4 /100 | #163 | Good 38.3% |
Demographics Similar to Immigrants from Guyana by Bachelor's Degree
In terms of bachelor's degree, the demographic groups most similar to Immigrants from Guyana are Delaware (33.8%, a difference of 0.50%), Immigrants from Fiji (33.7%, a difference of 0.59%), Nonimmigrants (34.2%, a difference of 0.64%), Immigrants from Cambodia (34.2%, a difference of 0.71%), and Jamaican (33.6%, a difference of 0.96%).
| Demographics | Rating | Rank | Bachelor's Degree |
| Liberians | 2.8 /100 | #236 | Tragic 34.6% |
| Tlingit-Haida | 2.8 /100 | #237 | Tragic 34.6% |
| Guyanese | 2.5 /100 | #238 | Tragic 34.5% |
| British West Indians | 2.5 /100 | #239 | Tragic 34.5% |
| Tongans | 2.0 /100 | #240 | Tragic 34.3% |
| Immigrants | Cambodia | 1.9 /100 | #241 | Tragic 34.2% |
| Immigrants | Nonimmigrants | 1.8 /100 | #242 | Tragic 34.2% |
| Immigrants | Guyana | 1.4 /100 | #243 | Tragic 33.9% |
| Delaware | 1.2 /100 | #244 | Tragic 33.8% |
| Immigrants | Fiji | 1.2 /100 | #245 | Tragic 33.7% |
| Jamaicans | 1.0 /100 | #246 | Tragic 33.6% |
| Immigrants | Congo | 1.0 /100 | #247 | Tragic 33.6% |
| Cree | 1.0 /100 | #248 | Tragic 33.6% |
| Immigrants | Liberia | 0.9 /100 | #249 | Tragic 33.5% |
| Indonesians | 0.9 /100 | #250 | Tragic 33.5% |