Kenyan vs Immigrants from Israel Bachelor's Degree
COMPARE
Kenyan
Immigrants from Israel
Bachelor's Degree
Bachelor's Degree Comparison
Kenyans
Immigrants from Israel
38.7%
BACHELOR'S DEGREE
72.5/ 100
METRIC RATING
156th/ 347
METRIC RANK
50.0%
BACHELOR'S DEGREE
100.0/ 100
METRIC RATING
9th/ 347
METRIC RANK
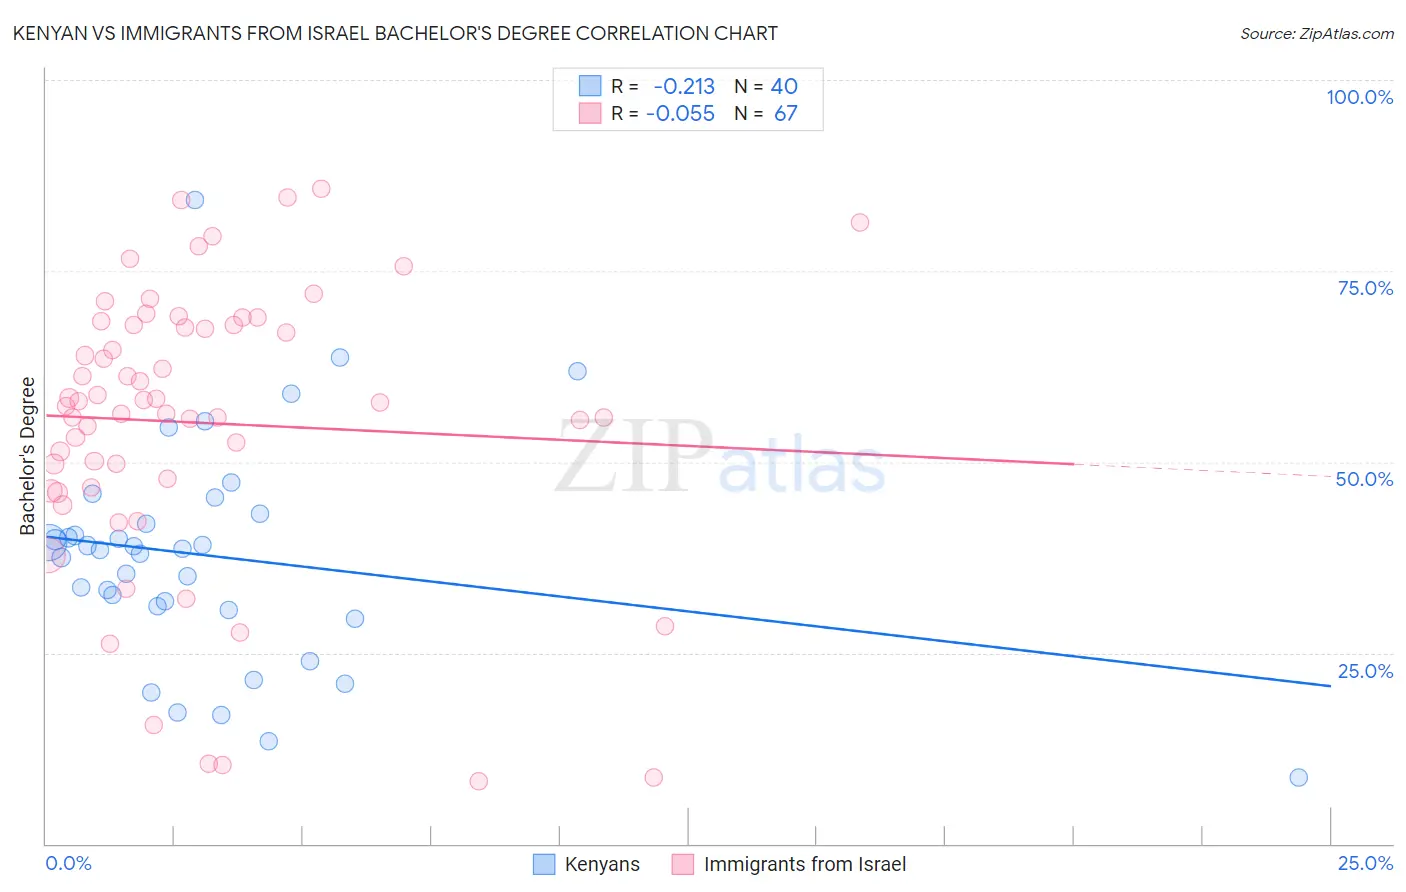
Kenyan vs Immigrants from Israel Bachelor's Degree Correlation Chart
The statistical analysis conducted on geographies consisting of 168,237,785 people shows a weak negative correlation between the proportion of Kenyans and percentage of population with at least bachelor's degree education in the United States with a correlation coefficient (R) of -0.213 and weighted average of 38.7%. Similarly, the statistical analysis conducted on geographies consisting of 210,024,310 people shows a slight negative correlation between the proportion of Immigrants from Israel and percentage of population with at least bachelor's degree education in the United States with a correlation coefficient (R) of -0.055 and weighted average of 50.0%, a difference of 29.1%.
Bachelor's Degree Correlation Summary
| Measurement | Kenyan | Immigrants from Israel |
| Minimum | 8.7% | 8.2% |
| Maximum | 84.3% | 85.8% |
| Range | 75.6% | 77.5% |
| Mean | 37.6% | 55.1% |
| Median | 38.6% | 57.8% |
| Interquartile 25% (IQ1) | 30.8% | 46.6% |
| Interquartile 75% (IQ3) | 42.5% | 67.9% |
| Interquartile Range (IQR) | 11.7% | 21.3% |
| Standard Deviation (Sample) | 14.7% | 18.6% |
| Standard Deviation (Population) | 14.5% | 18.4% |
Similar Demographics by Bachelor's Degree
Demographics Similar to Kenyans by Bachelor's Degree
In terms of bachelor's degree, the demographic groups most similar to Kenyans are Immigrants from Kenya (38.8%, a difference of 0.15%), Immigrants from South America (38.6%, a difference of 0.28%), Canadian (38.8%, a difference of 0.31%), Immigrants from Germany (38.6%, a difference of 0.34%), and Slavic (38.9%, a difference of 0.42%).
| Demographics | Rating | Rank | Bachelor's Degree |
| Immigrants | Poland | 77.5 /100 | #149 | Good 39.0% |
| South Americans | 77.3 /100 | #150 | Good 38.9% |
| Immigrants | Africa | 76.5 /100 | #151 | Good 38.9% |
| Sudanese | 76.4 /100 | #152 | Good 38.9% |
| Slavs | 75.9 /100 | #153 | Good 38.9% |
| Canadians | 75.0 /100 | #154 | Good 38.8% |
| Immigrants | Kenya | 73.8 /100 | #155 | Good 38.8% |
| Kenyans | 72.5 /100 | #156 | Good 38.7% |
| Immigrants | South America | 70.1 /100 | #157 | Good 38.6% |
| Immigrants | Germany | 69.6 /100 | #158 | Good 38.6% |
| Chinese | 66.6 /100 | #159 | Good 38.5% |
| Vietnamese | 66.6 /100 | #160 | Good 38.5% |
| Uruguayans | 65.8 /100 | #161 | Good 38.4% |
| Colombians | 65.0 /100 | #162 | Good 38.4% |
| Peruvians | 63.4 /100 | #163 | Good 38.3% |
Demographics Similar to Immigrants from Israel by Bachelor's Degree
In terms of bachelor's degree, the demographic groups most similar to Immigrants from Israel are Thai (50.1%, a difference of 0.24%), Immigrants from Iran (50.3%, a difference of 0.61%), Okinawan (50.5%, a difference of 1.1%), Iranian (51.0%, a difference of 1.9%), and Cypriot (49.0%, a difference of 1.9%).
| Demographics | Rating | Rank | Bachelor's Degree |
| Immigrants | Singapore | 100.0 /100 | #2 | Exceptional 51.9% |
| Immigrants | India | 100.0 /100 | #3 | Exceptional 51.3% |
| Immigrants | Taiwan | 100.0 /100 | #4 | Exceptional 51.2% |
| Iranians | 100.0 /100 | #5 | Exceptional 51.0% |
| Okinawans | 100.0 /100 | #6 | Exceptional 50.5% |
| Immigrants | Iran | 100.0 /100 | #7 | Exceptional 50.3% |
| Thais | 100.0 /100 | #8 | Exceptional 50.1% |
| Immigrants | Israel | 100.0 /100 | #9 | Exceptional 50.0% |
| Cypriots | 100.0 /100 | #10 | Exceptional 49.0% |
| Immigrants | Australia | 100.0 /100 | #11 | Exceptional 48.5% |
| Immigrants | China | 100.0 /100 | #12 | Exceptional 48.4% |
| Immigrants | South Central Asia | 100.0 /100 | #13 | Exceptional 48.3% |
| Immigrants | Hong Kong | 100.0 /100 | #14 | Exceptional 48.2% |
| Immigrants | Eastern Asia | 100.0 /100 | #15 | Exceptional 48.1% |
| Soviet Union | 100.0 /100 | #16 | Exceptional 47.9% |