Immigrants from Barbados vs Immigrants from Guyana Bachelor's Degree
COMPARE
Immigrants from Barbados
Immigrants from Guyana
Bachelor's Degree
Bachelor's Degree Comparison
Immigrants from Barbados
Immigrants from Guyana
35.5%
BACHELOR'S DEGREE
7.5/ 100
METRIC RATING
224th/ 347
METRIC RANK
33.9%
BACHELOR'S DEGREE
1.4/ 100
METRIC RATING
243rd/ 347
METRIC RANK
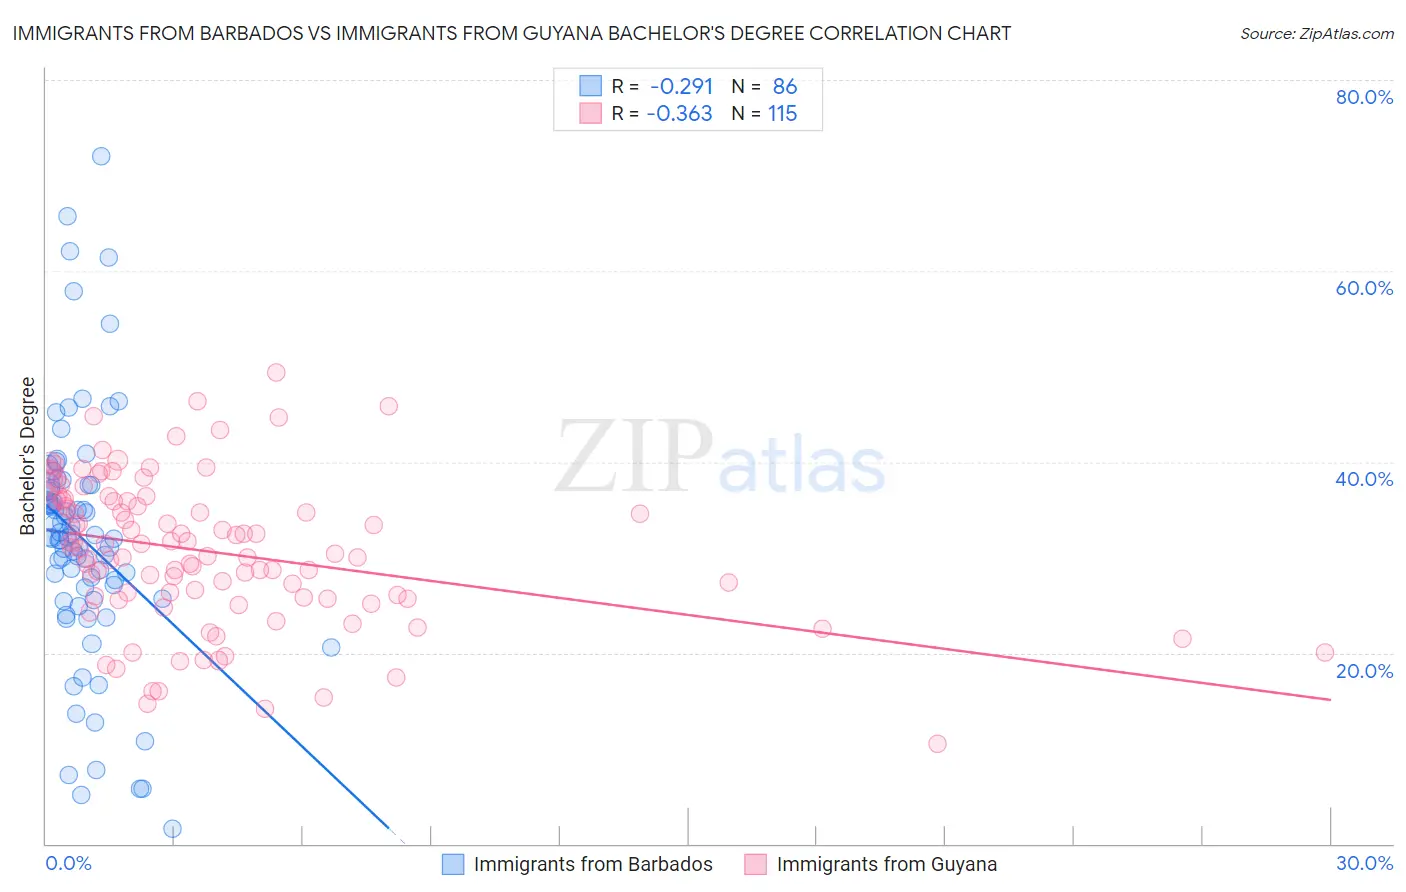
Immigrants from Barbados vs Immigrants from Guyana Bachelor's Degree Correlation Chart
The statistical analysis conducted on geographies consisting of 112,783,541 people shows a weak negative correlation between the proportion of Immigrants from Barbados and percentage of population with at least bachelor's degree education in the United States with a correlation coefficient (R) of -0.291 and weighted average of 35.5%. Similarly, the statistical analysis conducted on geographies consisting of 183,738,689 people shows a mild negative correlation between the proportion of Immigrants from Guyana and percentage of population with at least bachelor's degree education in the United States with a correlation coefficient (R) of -0.363 and weighted average of 33.9%, a difference of 4.6%.
Bachelor's Degree Correlation Summary
| Measurement | Immigrants from Barbados | Immigrants from Guyana |
| Minimum | 1.5% | 10.5% |
| Maximum | 72.0% | 49.4% |
| Range | 70.5% | 38.9% |
| Mean | 31.9% | 30.5% |
| Median | 32.0% | 31.0% |
| Interquartile 25% (IQ1) | 25.6% | 25.6% |
| Interquartile 75% (IQ3) | 37.5% | 36.0% |
| Interquartile Range (IQR) | 11.9% | 10.3% |
| Standard Deviation (Sample) | 13.0% | 7.7% |
| Standard Deviation (Population) | 12.9% | 7.7% |
Demographics Similar to Immigrants from Barbados and Immigrants from Guyana by Bachelor's Degree
In terms of bachelor's degree, the demographic groups most similar to Immigrants from Barbados are Immigrants from Burma/Myanmar (35.5%, a difference of 0.070%), Portuguese (35.5%, a difference of 0.11%), French Canadian (35.6%, a difference of 0.28%), Ecuadorian (35.4%, a difference of 0.37%), and Immigrants from Trinidad and Tobago (35.3%, a difference of 0.60%). Similarly, the demographic groups most similar to Immigrants from Guyana are Nonimmigrants (34.2%, a difference of 0.64%), Immigrants from Cambodia (34.2%, a difference of 0.71%), Tongan (34.3%, a difference of 0.97%), British West Indian (34.5%, a difference of 1.5%), and Guyanese (34.5%, a difference of 1.5%).
| Demographics | Rating | Rank | Bachelor's Degree |
| French Canadians | 8.3 /100 | #223 | Tragic 35.6% |
| Immigrants | Barbados | 7.5 /100 | #224 | Tragic 35.5% |
| Immigrants | Burma/Myanmar | 7.3 /100 | #225 | Tragic 35.5% |
| Portuguese | 7.2 /100 | #226 | Tragic 35.5% |
| Ecuadorians | 6.6 /100 | #227 | Tragic 35.4% |
| Immigrants | Trinidad and Tobago | 6.0 /100 | #228 | Tragic 35.3% |
| Whites/Caucasians | 5.9 /100 | #229 | Tragic 35.3% |
| Immigrants | Grenada | 4.3 /100 | #230 | Tragic 35.0% |
| Immigrants | St. Vincent and the Grenadines | 4.3 /100 | #231 | Tragic 35.0% |
| Hmong | 3.4 /100 | #232 | Tragic 34.8% |
| Immigrants | Ecuador | 3.3 /100 | #233 | Tragic 34.7% |
| Guamanians/Chamorros | 3.0 /100 | #234 | Tragic 34.6% |
| Immigrants | West Indies | 2.9 /100 | #235 | Tragic 34.6% |
| Liberians | 2.8 /100 | #236 | Tragic 34.6% |
| Tlingit-Haida | 2.8 /100 | #237 | Tragic 34.6% |
| Guyanese | 2.5 /100 | #238 | Tragic 34.5% |
| British West Indians | 2.5 /100 | #239 | Tragic 34.5% |
| Tongans | 2.0 /100 | #240 | Tragic 34.3% |
| Immigrants | Cambodia | 1.9 /100 | #241 | Tragic 34.2% |
| Immigrants | Nonimmigrants | 1.8 /100 | #242 | Tragic 34.2% |
| Immigrants | Guyana | 1.4 /100 | #243 | Tragic 33.9% |