Kenyan vs Immigrants from Haiti Bachelor's Degree
COMPARE
Kenyan
Immigrants from Haiti
Bachelor's Degree
Bachelor's Degree Comparison
Kenyans
Immigrants from Haiti
38.7%
BACHELOR'S DEGREE
72.5/ 100
METRIC RATING
156th/ 347
METRIC RANK
30.6%
BACHELOR'S DEGREE
0.0/ 100
METRIC RATING
297th/ 347
METRIC RANK
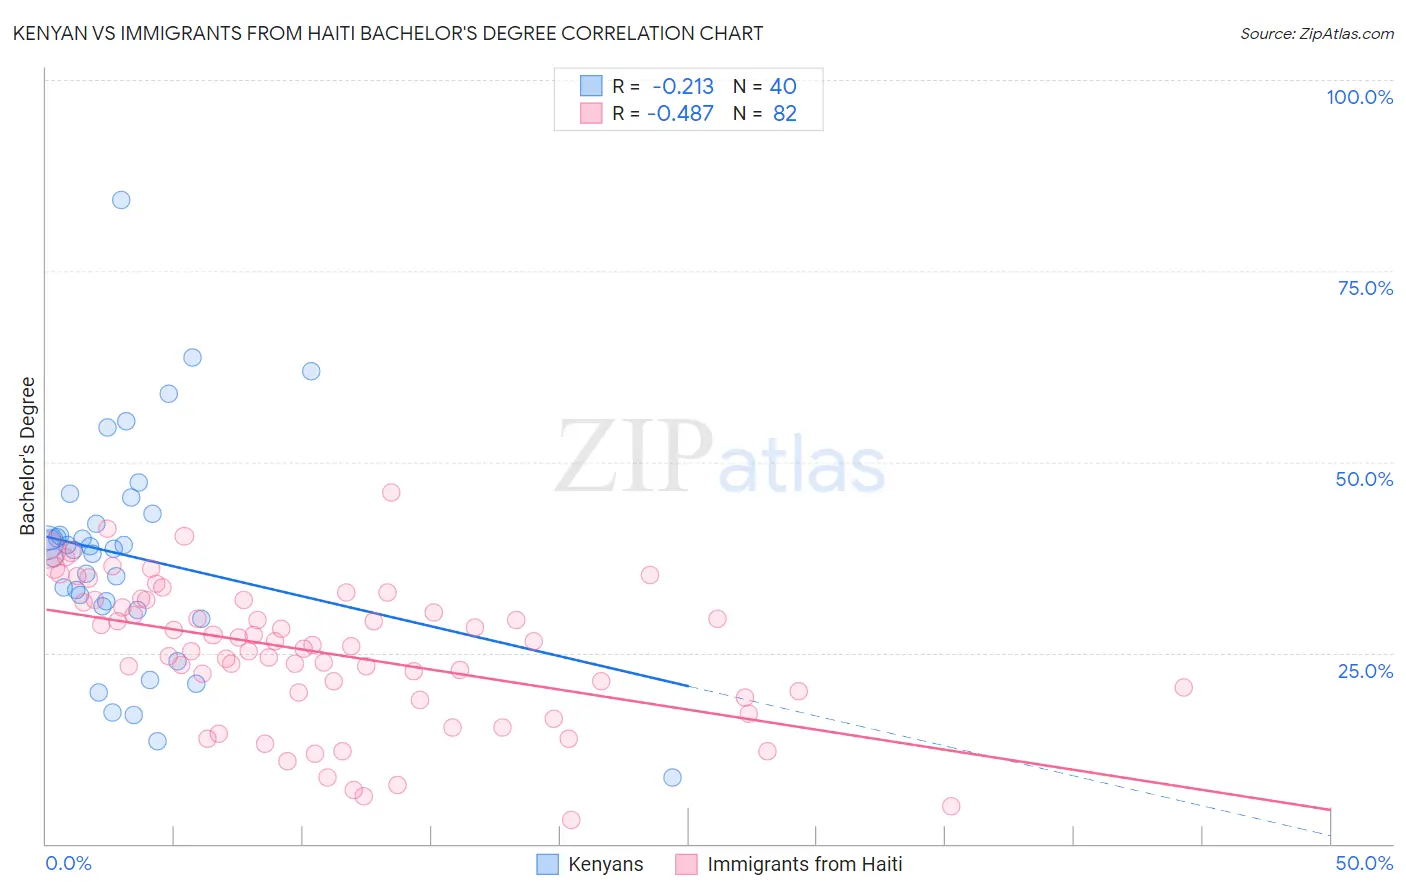
Kenyan vs Immigrants from Haiti Bachelor's Degree Correlation Chart
The statistical analysis conducted on geographies consisting of 168,237,785 people shows a weak negative correlation between the proportion of Kenyans and percentage of population with at least bachelor's degree education in the United States with a correlation coefficient (R) of -0.213 and weighted average of 38.7%. Similarly, the statistical analysis conducted on geographies consisting of 225,272,014 people shows a moderate negative correlation between the proportion of Immigrants from Haiti and percentage of population with at least bachelor's degree education in the United States with a correlation coefficient (R) of -0.487 and weighted average of 30.6%, a difference of 26.4%.
Bachelor's Degree Correlation Summary
| Measurement | Kenyan | Immigrants from Haiti |
| Minimum | 8.7% | 3.0% |
| Maximum | 84.3% | 46.1% |
| Range | 75.6% | 43.0% |
| Mean | 37.6% | 25.0% |
| Median | 38.6% | 25.9% |
| Interquartile 25% (IQ1) | 30.8% | 19.8% |
| Interquartile 75% (IQ3) | 42.5% | 31.9% |
| Interquartile Range (IQR) | 11.7% | 12.1% |
| Standard Deviation (Sample) | 14.7% | 9.2% |
| Standard Deviation (Population) | 14.5% | 9.2% |
Similar Demographics by Bachelor's Degree
Demographics Similar to Kenyans by Bachelor's Degree
In terms of bachelor's degree, the demographic groups most similar to Kenyans are Immigrants from Kenya (38.8%, a difference of 0.15%), Immigrants from South America (38.6%, a difference of 0.28%), Canadian (38.8%, a difference of 0.31%), Immigrants from Germany (38.6%, a difference of 0.34%), and Slavic (38.9%, a difference of 0.42%).
| Demographics | Rating | Rank | Bachelor's Degree |
| Immigrants | Poland | 77.5 /100 | #149 | Good 39.0% |
| South Americans | 77.3 /100 | #150 | Good 38.9% |
| Immigrants | Africa | 76.5 /100 | #151 | Good 38.9% |
| Sudanese | 76.4 /100 | #152 | Good 38.9% |
| Slavs | 75.9 /100 | #153 | Good 38.9% |
| Canadians | 75.0 /100 | #154 | Good 38.8% |
| Immigrants | Kenya | 73.8 /100 | #155 | Good 38.8% |
| Kenyans | 72.5 /100 | #156 | Good 38.7% |
| Immigrants | South America | 70.1 /100 | #157 | Good 38.6% |
| Immigrants | Germany | 69.6 /100 | #158 | Good 38.6% |
| Chinese | 66.6 /100 | #159 | Good 38.5% |
| Vietnamese | 66.6 /100 | #160 | Good 38.5% |
| Uruguayans | 65.8 /100 | #161 | Good 38.4% |
| Colombians | 65.0 /100 | #162 | Good 38.4% |
| Peruvians | 63.4 /100 | #163 | Good 38.3% |
Demographics Similar to Immigrants from Haiti by Bachelor's Degree
In terms of bachelor's degree, the demographic groups most similar to Immigrants from Haiti are Puget Sound Salish (30.7%, a difference of 0.060%), Immigrants from Dominican Republic (30.7%, a difference of 0.16%), Chippewa (30.6%, a difference of 0.25%), Immigrants from Guatemala (30.8%, a difference of 0.40%), and Chickasaw (30.4%, a difference of 0.77%).
| Demographics | Rating | Rank | Bachelor's Degree |
| Immigrants | Honduras | 0.1 /100 | #290 | Tragic 30.9% |
| Blacks/African Americans | 0.1 /100 | #291 | Tragic 30.9% |
| Ute | 0.1 /100 | #292 | Tragic 30.9% |
| Cape Verdeans | 0.1 /100 | #293 | Tragic 30.9% |
| Immigrants | Guatemala | 0.0 /100 | #294 | Tragic 30.8% |
| Immigrants | Dominican Republic | 0.0 /100 | #295 | Tragic 30.7% |
| Puget Sound Salish | 0.0 /100 | #296 | Tragic 30.7% |
| Immigrants | Haiti | 0.0 /100 | #297 | Tragic 30.6% |
| Chippewa | 0.0 /100 | #298 | Tragic 30.6% |
| Chickasaw | 0.0 /100 | #299 | Tragic 30.4% |
| Immigrants | Micronesia | 0.0 /100 | #300 | Tragic 30.4% |
| Immigrants | Cuba | 0.0 /100 | #301 | Tragic 30.3% |
| Mexican American Indians | 0.0 /100 | #302 | Tragic 30.2% |
| Bangladeshis | 0.0 /100 | #303 | Tragic 30.2% |
| Cherokee | 0.0 /100 | #304 | Tragic 30.2% |