Kenyan vs Immigrants from Guyana 9th Grade
COMPARE
Kenyan
Immigrants from Guyana
9th Grade
9th Grade Comparison
Kenyans
Immigrants from Guyana
95.1%
9TH GRADE
79.1/ 100
METRIC RATING
150th/ 347
METRIC RANK
92.5%
9TH GRADE
0.0/ 100
METRIC RATING
308th/ 347
METRIC RANK
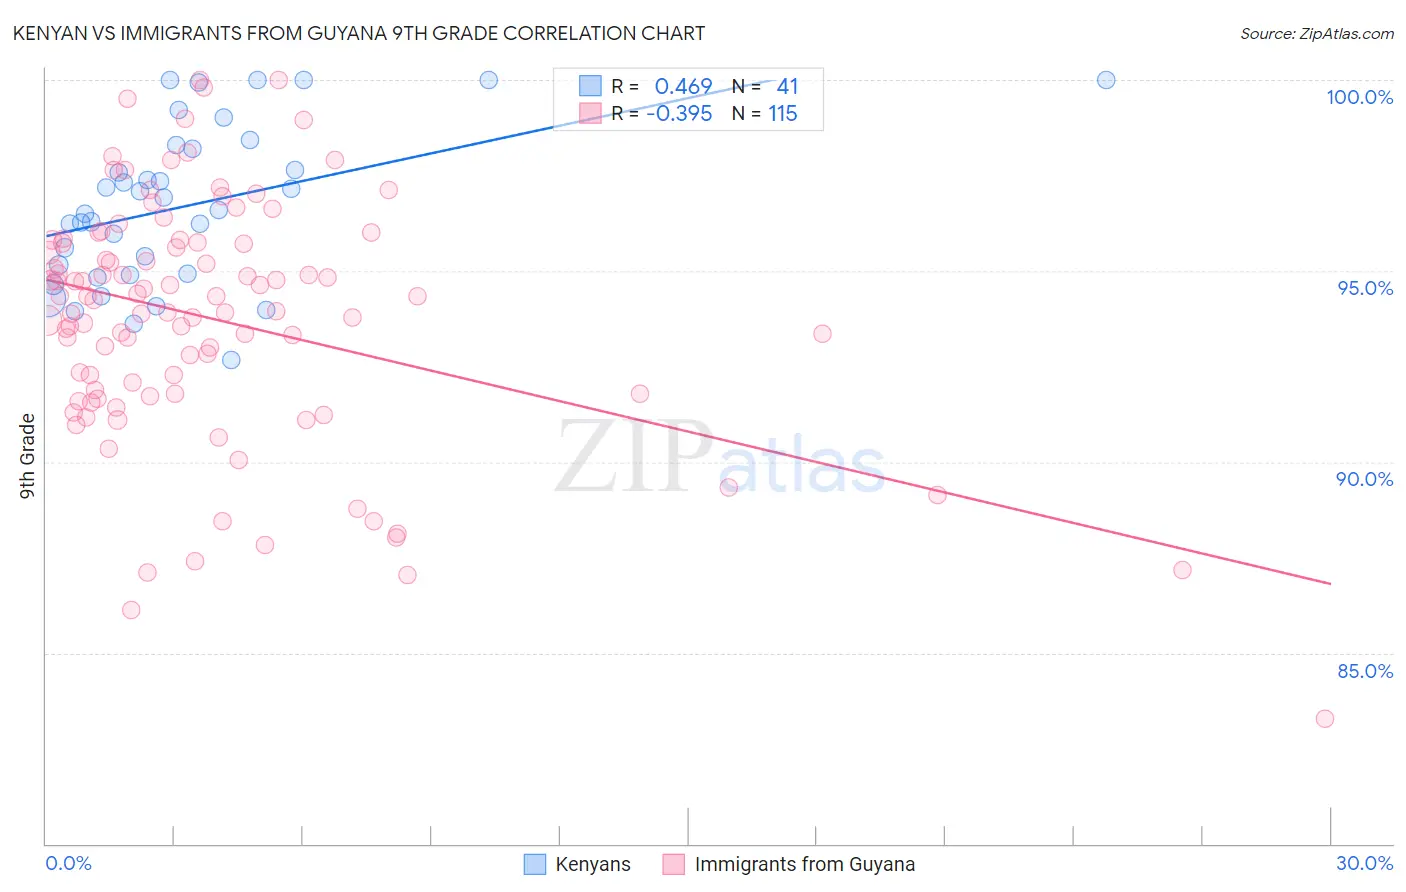
Kenyan vs Immigrants from Guyana 9th Grade Correlation Chart
The statistical analysis conducted on geographies consisting of 168,244,042 people shows a moderate positive correlation between the proportion of Kenyans and percentage of population with at least 9th grade education in the United States with a correlation coefficient (R) of 0.469 and weighted average of 95.1%. Similarly, the statistical analysis conducted on geographies consisting of 183,673,461 people shows a mild negative correlation between the proportion of Immigrants from Guyana and percentage of population with at least 9th grade education in the United States with a correlation coefficient (R) of -0.395 and weighted average of 92.5%, a difference of 2.8%.
9th Grade Correlation Summary
| Measurement | Kenyan | Immigrants from Guyana |
| Minimum | 92.7% | 83.3% |
| Maximum | 100.0% | 100.0% |
| Range | 7.3% | 16.7% |
| Mean | 96.7% | 93.7% |
| Median | 96.6% | 94.3% |
| Interquartile 25% (IQ1) | 94.9% | 91.8% |
| Interquartile 75% (IQ3) | 98.3% | 95.7% |
| Interquartile Range (IQR) | 3.3% | 4.0% |
| Standard Deviation (Sample) | 2.0% | 3.2% |
| Standard Deviation (Population) | 2.0% | 3.2% |
Similar Demographics by 9th Grade
Demographics Similar to Kenyans by 9th Grade
In terms of 9th grade, the demographic groups most similar to Kenyans are Immigrants from Korea (95.1%, a difference of 0.010%), Immigrants from Jordan (95.1%, a difference of 0.020%), Cajun (95.1%, a difference of 0.020%), Ugandan (95.1%, a difference of 0.020%), and Choctaw (95.1%, a difference of 0.030%).
| Demographics | Rating | Rank | 9th Grade |
| Spanish | 84.4 /100 | #143 | Excellent 95.2% |
| Yup'ik | 83.3 /100 | #144 | Excellent 95.2% |
| Pueblo | 82.2 /100 | #145 | Excellent 95.1% |
| Immigrants | Sri Lanka | 82.1 /100 | #146 | Excellent 95.1% |
| Choctaw | 81.9 /100 | #147 | Excellent 95.1% |
| Immigrants | Jordan | 81.2 /100 | #148 | Excellent 95.1% |
| Immigrants | Korea | 79.6 /100 | #149 | Good 95.1% |
| Kenyans | 79.1 /100 | #150 | Good 95.1% |
| Cajuns | 77.3 /100 | #151 | Good 95.1% |
| Ugandans | 77.0 /100 | #152 | Good 95.1% |
| Albanians | 76.1 /100 | #153 | Good 95.1% |
| Arabs | 74.9 /100 | #154 | Good 95.1% |
| Immigrants | Kazakhstan | 74.7 /100 | #155 | Good 95.1% |
| Immigrants | Kenya | 73.1 /100 | #156 | Good 95.0% |
| Mongolians | 73.0 /100 | #157 | Good 95.0% |
Demographics Similar to Immigrants from Guyana by 9th Grade
In terms of 9th grade, the demographic groups most similar to Immigrants from Guyana are Immigrants (92.5%, a difference of 0.010%), Japanese (92.6%, a difference of 0.11%), Immigrants from Vietnam (92.6%, a difference of 0.11%), Tohono O'odham (92.6%, a difference of 0.13%), and Guyanese (92.7%, a difference of 0.15%).
| Demographics | Rating | Rank | 9th Grade |
| Immigrants | Haiti | 0.0 /100 | #301 | Tragic 92.7% |
| Immigrants | Dominica | 0.0 /100 | #302 | Tragic 92.7% |
| Guyanese | 0.0 /100 | #303 | Tragic 92.7% |
| Tohono O'odham | 0.0 /100 | #304 | Tragic 92.6% |
| Japanese | 0.0 /100 | #305 | Tragic 92.6% |
| Immigrants | Vietnam | 0.0 /100 | #306 | Tragic 92.6% |
| Immigrants | Immigrants | 0.0 /100 | #307 | Tragic 92.5% |
| Immigrants | Guyana | 0.0 /100 | #308 | Tragic 92.5% |
| Immigrants | Bangladesh | 0.0 /100 | #309 | Tragic 92.4% |
| Immigrants | Cambodia | 0.0 /100 | #310 | Tragic 92.4% |
| Immigrants | Fiji | 0.0 /100 | #311 | Tragic 92.3% |
| Houma | 0.0 /100 | #312 | Tragic 92.3% |
| Vietnamese | 0.0 /100 | #313 | Tragic 92.3% |
| Immigrants | Portugal | 0.0 /100 | #314 | Tragic 92.2% |
| Immigrants | Caribbean | 0.0 /100 | #315 | Tragic 92.2% |