Kenyan vs Immigrants from Uganda Bachelor's Degree
COMPARE
Kenyan
Immigrants from Uganda
Bachelor's Degree
Bachelor's Degree Comparison
Kenyans
Immigrants from Uganda
38.7%
BACHELOR'S DEGREE
72.5/ 100
METRIC RATING
156th/ 347
METRIC RANK
40.7%
BACHELOR'S DEGREE
95.7/ 100
METRIC RATING
116th/ 347
METRIC RANK
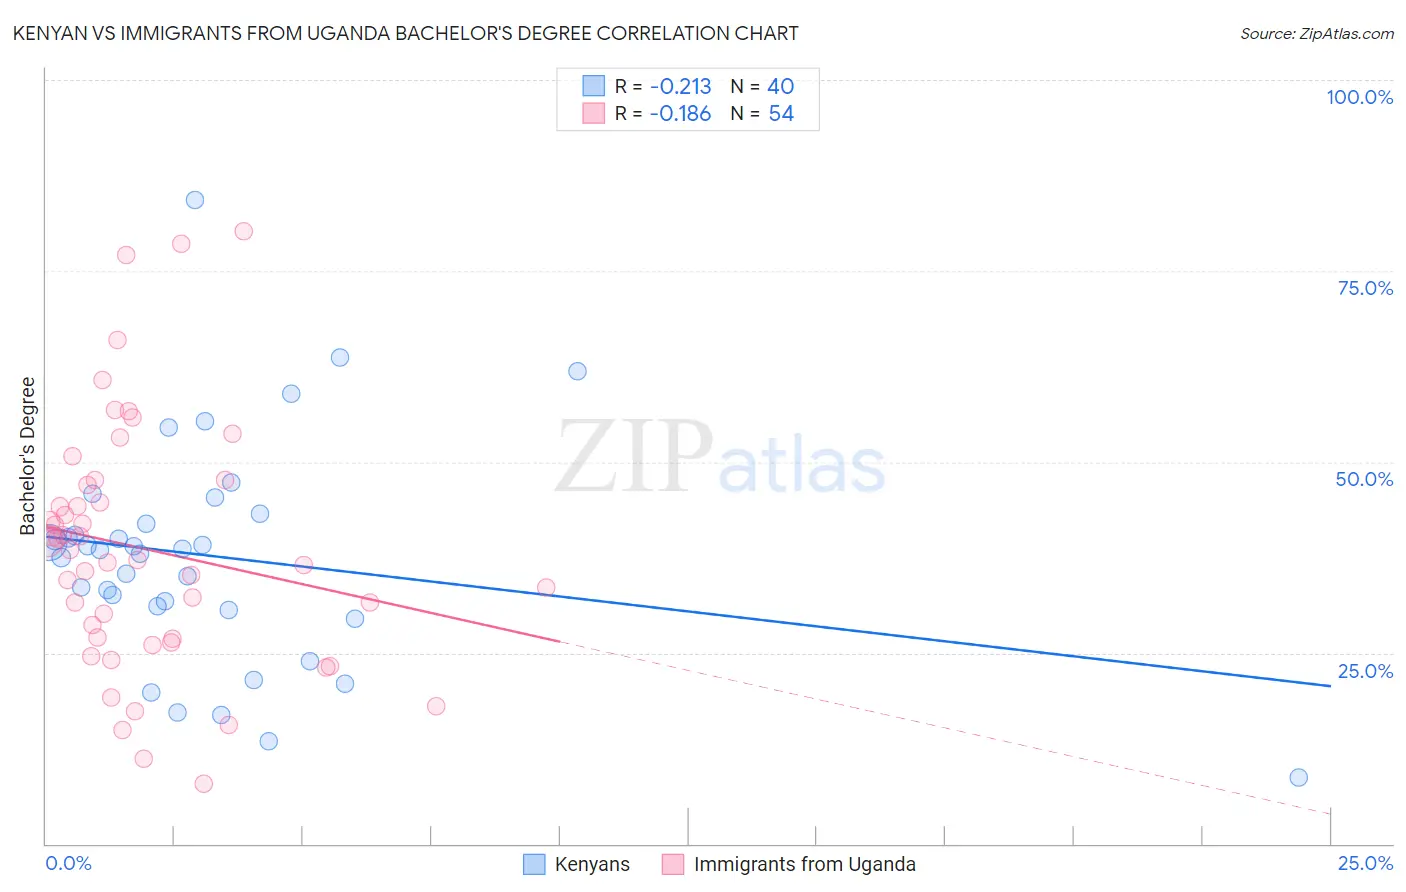
Kenyan vs Immigrants from Uganda Bachelor's Degree Correlation Chart
The statistical analysis conducted on geographies consisting of 168,237,785 people shows a weak negative correlation between the proportion of Kenyans and percentage of population with at least bachelor's degree education in the United States with a correlation coefficient (R) of -0.213 and weighted average of 38.7%. Similarly, the statistical analysis conducted on geographies consisting of 125,980,358 people shows a poor negative correlation between the proportion of Immigrants from Uganda and percentage of population with at least bachelor's degree education in the United States with a correlation coefficient (R) of -0.186 and weighted average of 40.7%, a difference of 5.1%.
Bachelor's Degree Correlation Summary
| Measurement | Kenyan | Immigrants from Uganda |
| Minimum | 8.7% | 7.9% |
| Maximum | 84.3% | 80.2% |
| Range | 75.6% | 72.3% |
| Mean | 37.6% | 38.5% |
| Median | 38.6% | 37.9% |
| Interquartile 25% (IQ1) | 30.8% | 26.9% |
| Interquartile 75% (IQ3) | 42.5% | 47.0% |
| Interquartile Range (IQR) | 11.7% | 20.2% |
| Standard Deviation (Sample) | 14.7% | 16.2% |
| Standard Deviation (Population) | 14.5% | 16.0% |
Similar Demographics by Bachelor's Degree
Demographics Similar to Kenyans by Bachelor's Degree
In terms of bachelor's degree, the demographic groups most similar to Kenyans are Immigrants from Kenya (38.8%, a difference of 0.15%), Immigrants from South America (38.6%, a difference of 0.28%), Canadian (38.8%, a difference of 0.31%), Immigrants from Germany (38.6%, a difference of 0.34%), and Slavic (38.9%, a difference of 0.42%).
| Demographics | Rating | Rank | Bachelor's Degree |
| Immigrants | Poland | 77.5 /100 | #149 | Good 39.0% |
| South Americans | 77.3 /100 | #150 | Good 38.9% |
| Immigrants | Africa | 76.5 /100 | #151 | Good 38.9% |
| Sudanese | 76.4 /100 | #152 | Good 38.9% |
| Slavs | 75.9 /100 | #153 | Good 38.9% |
| Canadians | 75.0 /100 | #154 | Good 38.8% |
| Immigrants | Kenya | 73.8 /100 | #155 | Good 38.8% |
| Kenyans | 72.5 /100 | #156 | Good 38.7% |
| Immigrants | South America | 70.1 /100 | #157 | Good 38.6% |
| Immigrants | Germany | 69.6 /100 | #158 | Good 38.6% |
| Chinese | 66.6 /100 | #159 | Good 38.5% |
| Vietnamese | 66.6 /100 | #160 | Good 38.5% |
| Uruguayans | 65.8 /100 | #161 | Good 38.4% |
| Colombians | 65.0 /100 | #162 | Good 38.4% |
| Peruvians | 63.4 /100 | #163 | Good 38.3% |
Demographics Similar to Immigrants from Uganda by Bachelor's Degree
In terms of bachelor's degree, the demographic groups most similar to Immigrants from Uganda are Palestinian (40.7%, a difference of 0.050%), Austrian (40.6%, a difference of 0.10%), Croatian (40.6%, a difference of 0.12%), Afghan (40.8%, a difference of 0.29%), and Brazilian (40.8%, a difference of 0.32%).
| Demographics | Rating | Rank | Bachelor's Degree |
| Arabs | 96.6 /100 | #109 | Exceptional 40.9% |
| Albanians | 96.5 /100 | #110 | Exceptional 40.9% |
| Immigrants | Chile | 96.4 /100 | #111 | Exceptional 40.8% |
| Ugandans | 96.3 /100 | #112 | Exceptional 40.8% |
| Brazilians | 96.3 /100 | #113 | Exceptional 40.8% |
| Afghans | 96.2 /100 | #114 | Exceptional 40.8% |
| Palestinians | 95.8 /100 | #115 | Exceptional 40.7% |
| Immigrants | Uganda | 95.7 /100 | #116 | Exceptional 40.7% |
| Austrians | 95.5 /100 | #117 | Exceptional 40.6% |
| Croatians | 95.5 /100 | #118 | Exceptional 40.6% |
| Immigrants | Syria | 94.9 /100 | #119 | Exceptional 40.5% |
| Venezuelans | 94.7 /100 | #120 | Exceptional 40.5% |
| Moroccans | 94.6 /100 | #121 | Exceptional 40.5% |
| Immigrants | Albania | 94.4 /100 | #122 | Exceptional 40.4% |
| Lebanese | 94.3 /100 | #123 | Exceptional 40.4% |