Kenyan vs Alsatian Master's Degree
COMPARE
Kenyan
Alsatian
Master's Degree
Master's Degree Comparison
Kenyans
Alsatians
15.3%
MASTER'S DEGREE
70.3/ 100
METRIC RATING
160th/ 347
METRIC RANK
16.9%
MASTER'S DEGREE
98.4/ 100
METRIC RATING
103rd/ 347
METRIC RANK
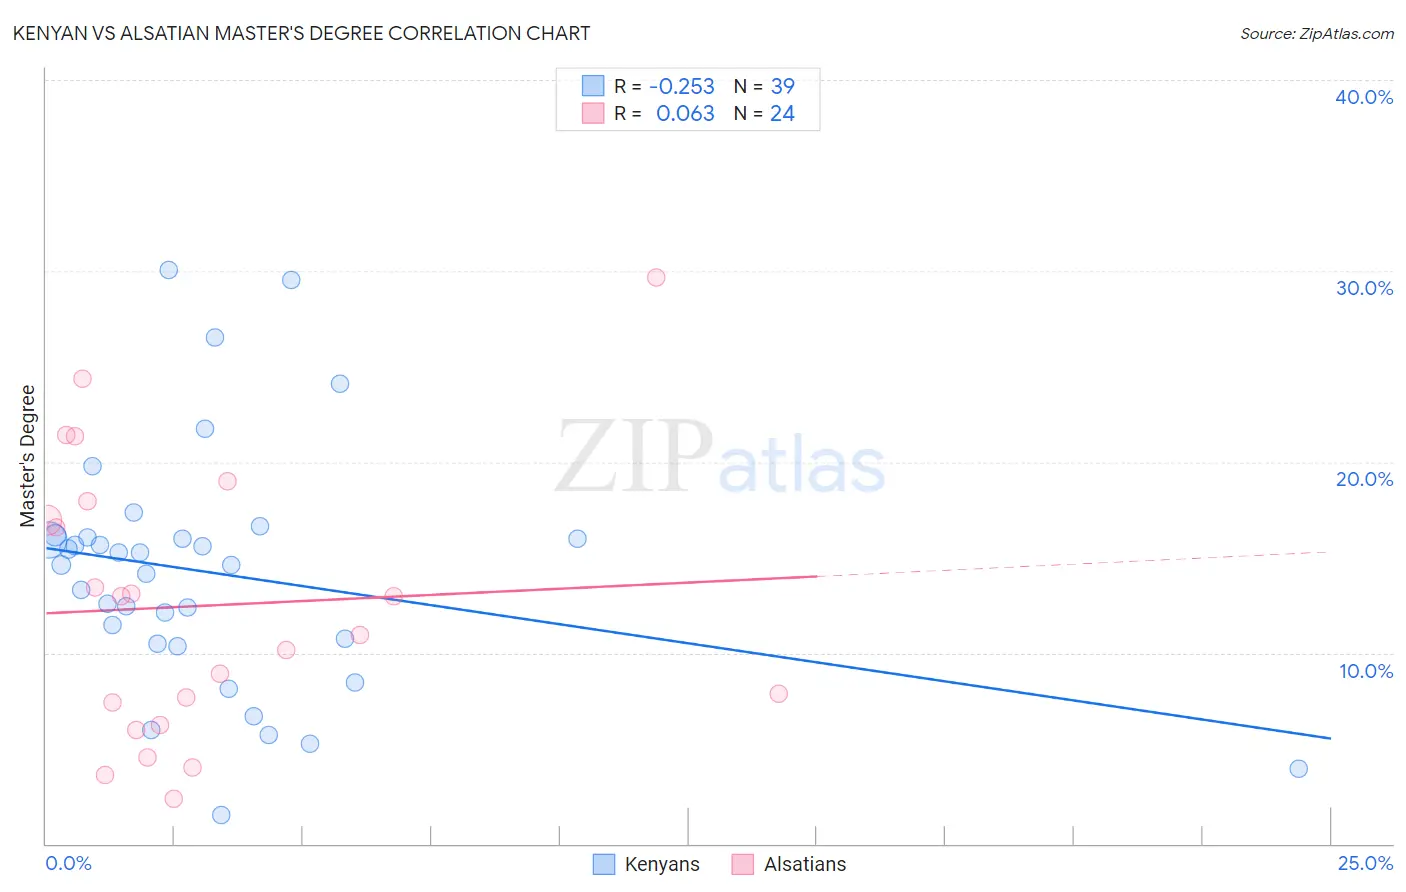
Kenyan vs Alsatian Master's Degree Correlation Chart
The statistical analysis conducted on geographies consisting of 168,212,419 people shows a weak negative correlation between the proportion of Kenyans and percentage of population with at least master's degree education in the United States with a correlation coefficient (R) of -0.253 and weighted average of 15.3%. Similarly, the statistical analysis conducted on geographies consisting of 82,679,386 people shows a slight positive correlation between the proportion of Alsatians and percentage of population with at least master's degree education in the United States with a correlation coefficient (R) of 0.063 and weighted average of 16.9%, a difference of 10.1%.
Master's Degree Correlation Summary
| Measurement | Kenyan | Alsatian |
| Minimum | 1.5% | 2.4% |
| Maximum | 30.0% | 29.7% |
| Range | 28.5% | 27.3% |
| Mean | 14.2% | 12.5% |
| Median | 14.6% | 11.9% |
| Interquartile 25% (IQ1) | 10.5% | 6.8% |
| Interquartile 75% (IQ3) | 16.0% | 17.4% |
| Interquartile Range (IQR) | 5.6% | 10.6% |
| Standard Deviation (Sample) | 6.4% | 7.2% |
| Standard Deviation (Population) | 6.3% | 7.1% |
Similar Demographics by Master's Degree
Demographics Similar to Kenyans by Master's Degree
In terms of master's degree, the demographic groups most similar to Kenyans are Luxembourger (15.3%, a difference of 0.11%), Immigrants from Poland (15.4%, a difference of 0.18%), Immigrants from Cameroon (15.4%, a difference of 0.22%), Sudanese (15.3%, a difference of 0.23%), and Peruvian (15.3%, a difference of 0.24%).
| Demographics | Rating | Rank | Master's Degree |
| Icelanders | 76.8 /100 | #153 | Good 15.5% |
| Immigrants | South America | 76.3 /100 | #154 | Good 15.5% |
| Immigrants | Bangladesh | 76.1 /100 | #155 | Good 15.5% |
| Bermudans | 73.9 /100 | #156 | Good 15.4% |
| Immigrants | Cameroon | 71.7 /100 | #157 | Good 15.4% |
| Immigrants | Poland | 71.5 /100 | #158 | Good 15.4% |
| Luxembourgers | 71.0 /100 | #159 | Good 15.3% |
| Kenyans | 70.3 /100 | #160 | Good 15.3% |
| Sudanese | 68.7 /100 | #161 | Good 15.3% |
| Peruvians | 68.7 /100 | #162 | Good 15.3% |
| Uruguayans | 67.1 /100 | #163 | Good 15.3% |
| Colombians | 66.9 /100 | #164 | Good 15.3% |
| Immigrants | Kenya | 66.6 /100 | #165 | Good 15.3% |
| Swedes | 66.1 /100 | #166 | Good 15.2% |
| Senegalese | 65.6 /100 | #167 | Good 15.2% |
Demographics Similar to Alsatians by Master's Degree
In terms of master's degree, the demographic groups most similar to Alsatians are Ukrainian (16.9%, a difference of 0.12%), Syrian (16.8%, a difference of 0.22%), Chilean (16.9%, a difference of 0.33%), Immigrants from Nepal (17.0%, a difference of 0.41%), and Immigrants from Albania (16.8%, a difference of 0.50%).
| Demographics | Rating | Rank | Master's Degree |
| Immigrants | Northern Africa | 98.9 /100 | #96 | Exceptional 17.1% |
| Immigrants | England | 98.8 /100 | #97 | Exceptional 17.0% |
| Immigrants | Ukraine | 98.8 /100 | #98 | Exceptional 17.0% |
| Laotians | 98.8 /100 | #99 | Exceptional 17.0% |
| Albanians | 98.7 /100 | #100 | Exceptional 17.0% |
| Immigrants | Nepal | 98.6 /100 | #101 | Exceptional 17.0% |
| Chileans | 98.6 /100 | #102 | Exceptional 16.9% |
| Alsatians | 98.4 /100 | #103 | Exceptional 16.9% |
| Ukrainians | 98.3 /100 | #104 | Exceptional 16.9% |
| Syrians | 98.3 /100 | #105 | Exceptional 16.8% |
| Immigrants | Albania | 98.1 /100 | #106 | Exceptional 16.8% |
| Armenians | 98.0 /100 | #107 | Exceptional 16.8% |
| Sierra Leoneans | 98.0 /100 | #108 | Exceptional 16.8% |
| Moroccans | 98.0 /100 | #109 | Exceptional 16.8% |
| Immigrants | Chile | 98.0 /100 | #110 | Exceptional 16.8% |