Kenyan vs Polish Master's Degree
COMPARE
Kenyan
Polish
Master's Degree
Master's Degree Comparison
Kenyans
Poles
15.3%
MASTER'S DEGREE
70.3/ 100
METRIC RATING
160th/ 347
METRIC RANK
15.7%
MASTER'S DEGREE
85.0/ 100
METRIC RATING
141st/ 347
METRIC RANK
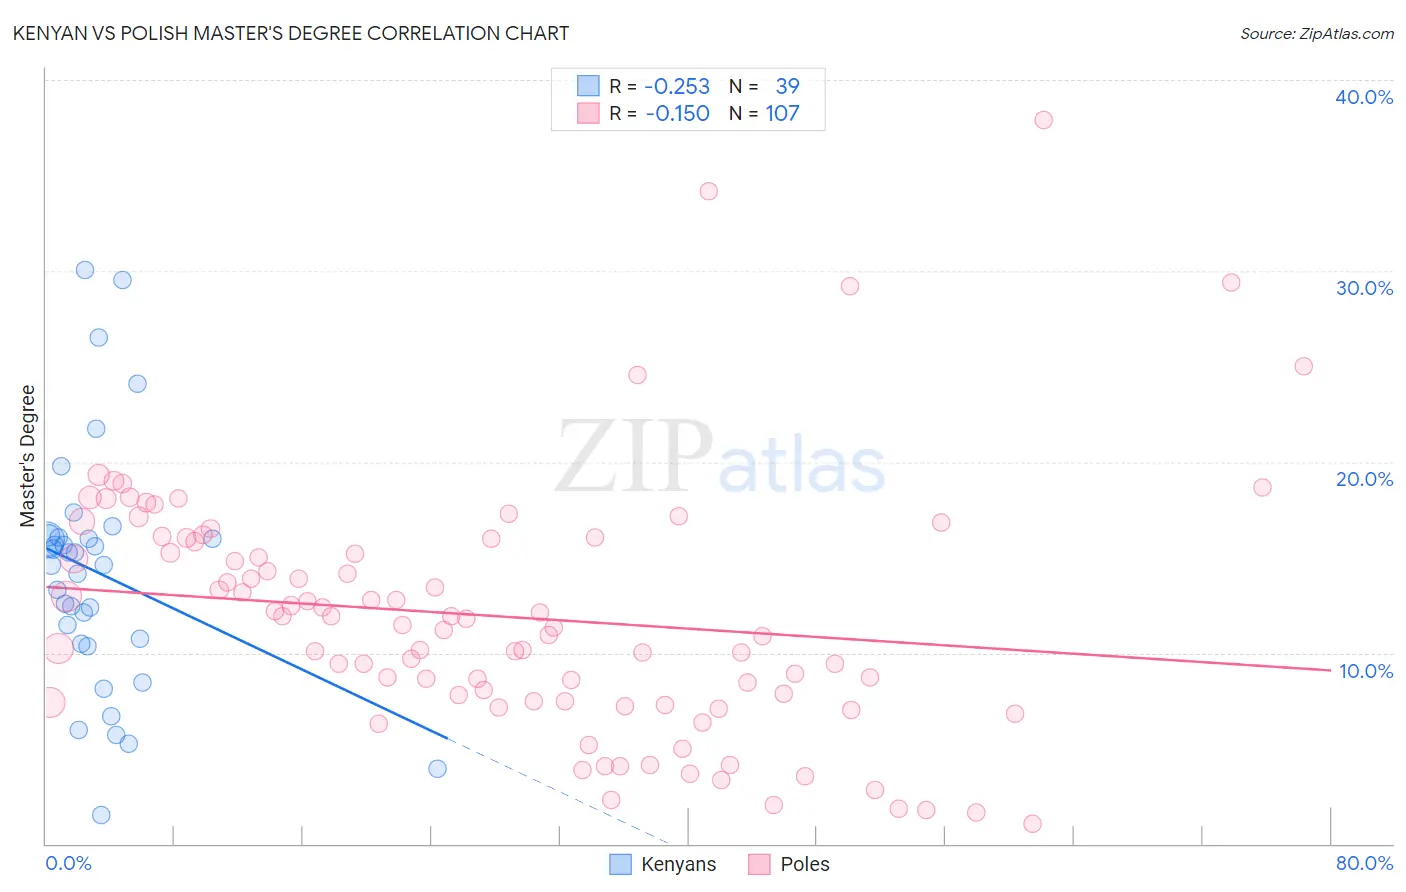
Kenyan vs Polish Master's Degree Correlation Chart
The statistical analysis conducted on geographies consisting of 168,212,419 people shows a weak negative correlation between the proportion of Kenyans and percentage of population with at least master's degree education in the United States with a correlation coefficient (R) of -0.253 and weighted average of 15.3%. Similarly, the statistical analysis conducted on geographies consisting of 559,882,025 people shows a poor negative correlation between the proportion of Poles and percentage of population with at least master's degree education in the United States with a correlation coefficient (R) of -0.150 and weighted average of 15.7%, a difference of 2.7%.
Master's Degree Correlation Summary
| Measurement | Kenyan | Polish |
| Minimum | 1.5% | 1.0% |
| Maximum | 30.0% | 37.9% |
| Range | 28.5% | 36.9% |
| Mean | 14.2% | 11.9% |
| Median | 14.6% | 11.5% |
| Interquartile 25% (IQ1) | 10.5% | 7.4% |
| Interquartile 75% (IQ3) | 16.0% | 16.0% |
| Interquartile Range (IQR) | 5.6% | 8.5% |
| Standard Deviation (Sample) | 6.4% | 6.6% |
| Standard Deviation (Population) | 6.3% | 6.6% |
Demographics Similar to Kenyans and Poles by Master's Degree
In terms of master's degree, the demographic groups most similar to Kenyans are Luxembourger (15.3%, a difference of 0.11%), Immigrants from Poland (15.4%, a difference of 0.18%), Immigrants from Cameroon (15.4%, a difference of 0.22%), Bermudan (15.4%, a difference of 0.56%), and Immigrants from Bangladesh (15.5%, a difference of 0.92%). Similarly, the demographic groups most similar to Poles are Vietnamese (15.8%, a difference of 0.12%), Immigrants from Africa (15.7%, a difference of 0.23%), Immigrants from Venezuela (15.7%, a difference of 0.32%), Canadian (15.7%, a difference of 0.40%), and South American (15.6%, a difference of 0.82%).
| Demographics | Rating | Rank | Master's Degree |
| Vietnamese | 85.5 /100 | #140 | Excellent 15.8% |
| Poles | 85.0 /100 | #141 | Excellent 15.7% |
| Immigrants | Africa | 84.0 /100 | #142 | Excellent 15.7% |
| Immigrants | Venezuela | 83.6 /100 | #143 | Excellent 15.7% |
| Canadians | 83.3 /100 | #144 | Excellent 15.7% |
| South Americans | 81.3 /100 | #145 | Excellent 15.6% |
| Immigrants | Afghanistan | 79.4 /100 | #146 | Good 15.6% |
| Hungarians | 79.1 /100 | #147 | Good 15.6% |
| Immigrants | Senegal | 78.2 /100 | #148 | Good 15.5% |
| Ghanaians | 78.2 /100 | #149 | Good 15.5% |
| Slovenes | 78.0 /100 | #150 | Good 15.5% |
| Iraqis | 77.3 /100 | #151 | Good 15.5% |
| Slavs | 77.0 /100 | #152 | Good 15.5% |
| Icelanders | 76.8 /100 | #153 | Good 15.5% |
| Immigrants | South America | 76.3 /100 | #154 | Good 15.5% |
| Immigrants | Bangladesh | 76.1 /100 | #155 | Good 15.5% |
| Bermudans | 73.9 /100 | #156 | Good 15.4% |
| Immigrants | Cameroon | 71.7 /100 | #157 | Good 15.4% |
| Immigrants | Poland | 71.5 /100 | #158 | Good 15.4% |
| Luxembourgers | 71.0 /100 | #159 | Good 15.3% |
| Kenyans | 70.3 /100 | #160 | Good 15.3% |