Immigrants from Guyana vs Cypriot Master's Degree
COMPARE
Immigrants from Guyana
Cypriot
Master's Degree
Master's Degree Comparison
Immigrants from Guyana
Cypriots
13.4%
MASTER'S DEGREE
4.4/ 100
METRIC RATING
236th/ 347
METRIC RANK
21.8%
MASTER'S DEGREE
100.0/ 100
METRIC RATING
8th/ 347
METRIC RANK
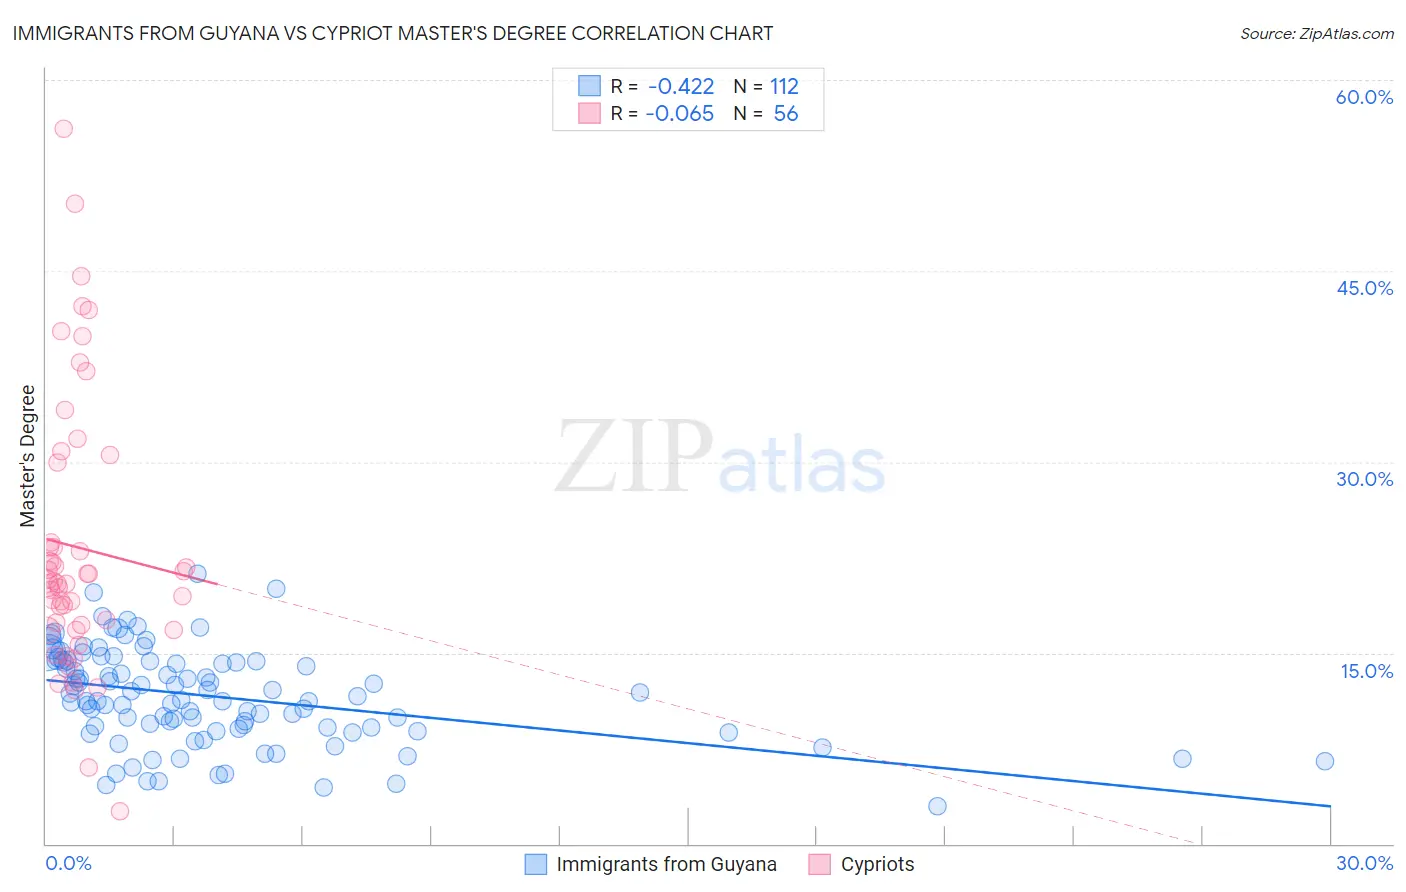
Immigrants from Guyana vs Cypriot Master's Degree Correlation Chart
The statistical analysis conducted on geographies consisting of 183,731,921 people shows a moderate negative correlation between the proportion of Immigrants from Guyana and percentage of population with at least master's degree education in the United States with a correlation coefficient (R) of -0.422 and weighted average of 13.4%. Similarly, the statistical analysis conducted on geographies consisting of 61,862,826 people shows a slight negative correlation between the proportion of Cypriots and percentage of population with at least master's degree education in the United States with a correlation coefficient (R) of -0.065 and weighted average of 21.8%, a difference of 62.0%.
Master's Degree Correlation Summary
| Measurement | Immigrants from Guyana | Cypriot |
| Minimum | 3.0% | 2.5% |
| Maximum | 21.2% | 56.1% |
| Range | 18.3% | 53.6% |
| Mean | 11.6% | 23.3% |
| Median | 11.5% | 20.5% |
| Interquartile 25% (IQ1) | 9.1% | 17.0% |
| Interquartile 75% (IQ3) | 14.3% | 26.8% |
| Interquartile Range (IQR) | 5.3% | 9.8% |
| Standard Deviation (Sample) | 3.7% | 10.7% |
| Standard Deviation (Population) | 3.7% | 10.6% |
Similar Demographics by Master's Degree
Demographics Similar to Immigrants from Guyana by Master's Degree
In terms of master's degree, the demographic groups most similar to Immigrants from Guyana are German Russian (13.5%, a difference of 0.11%), Jamaican (13.4%, a difference of 0.22%), Hmong (13.4%, a difference of 0.36%), Immigrants from Burma/Myanmar (13.5%, a difference of 0.52%), and Nonimmigrants (13.3%, a difference of 0.89%).
| Demographics | Rating | Rank | Master's Degree |
| British West Indians | 8.8 /100 | #229 | Tragic 13.8% |
| Dutch | 8.7 /100 | #230 | Tragic 13.8% |
| Guyanese | 7.6 /100 | #231 | Tragic 13.7% |
| Immigrants | Philippines | 6.0 /100 | #232 | Tragic 13.6% |
| Immigrants | Ecuador | 5.7 /100 | #233 | Tragic 13.6% |
| Immigrants | Burma/Myanmar | 5.0 /100 | #234 | Tragic 13.5% |
| German Russians | 4.5 /100 | #235 | Tragic 13.5% |
| Immigrants | Guyana | 4.4 /100 | #236 | Tragic 13.4% |
| Jamaicans | 4.1 /100 | #237 | Tragic 13.4% |
| Hmong | 4.0 /100 | #238 | Tragic 13.4% |
| Immigrants | Nonimmigrants | 3.4 /100 | #239 | Tragic 13.3% |
| Guamanians/Chamorros | 2.2 /100 | #240 | Tragic 13.1% |
| U.S. Virgin Islanders | 2.1 /100 | #241 | Tragic 13.1% |
| Spanish Americans | 1.9 /100 | #242 | Tragic 13.0% |
| Immigrants | Jamaica | 1.9 /100 | #243 | Tragic 13.0% |
Demographics Similar to Cypriots by Master's Degree
In terms of master's degree, the demographic groups most similar to Cypriots are Thai (21.7%, a difference of 0.34%), Immigrants from Iran (21.6%, a difference of 0.75%), Iranian (22.3%, a difference of 2.2%), Immigrants from India (22.3%, a difference of 2.4%), and Immigrants from China (21.2%, a difference of 2.9%).
| Demographics | Rating | Rank | Master's Degree |
| Immigrants | Singapore | 100.0 /100 | #1 | Exceptional 23.4% |
| Filipinos | 100.0 /100 | #2 | Exceptional 23.4% |
| Immigrants | Israel | 100.0 /100 | #3 | Exceptional 22.6% |
| Okinawans | 100.0 /100 | #4 | Exceptional 22.6% |
| Immigrants | Taiwan | 100.0 /100 | #5 | Exceptional 22.5% |
| Immigrants | India | 100.0 /100 | #6 | Exceptional 22.3% |
| Iranians | 100.0 /100 | #7 | Exceptional 22.3% |
| Cypriots | 100.0 /100 | #8 | Exceptional 21.8% |
| Thais | 100.0 /100 | #9 | Exceptional 21.7% |
| Immigrants | Iran | 100.0 /100 | #10 | Exceptional 21.6% |
| Immigrants | China | 100.0 /100 | #11 | Exceptional 21.2% |
| Eastern Europeans | 100.0 /100 | #12 | Exceptional 21.1% |
| Immigrants | Australia | 100.0 /100 | #13 | Exceptional 20.9% |
| Immigrants | Switzerland | 100.0 /100 | #14 | Exceptional 20.9% |
| Immigrants | Eastern Asia | 100.0 /100 | #15 | Exceptional 20.8% |