Immigrants from England vs Cypriot Master's Degree
COMPARE
Immigrants from England
Cypriot
Master's Degree
Master's Degree Comparison
Immigrants from England
Cypriots
17.0%
MASTER'S DEGREE
98.8/ 100
METRIC RATING
97th/ 347
METRIC RANK
21.8%
MASTER'S DEGREE
100.0/ 100
METRIC RATING
8th/ 347
METRIC RANK
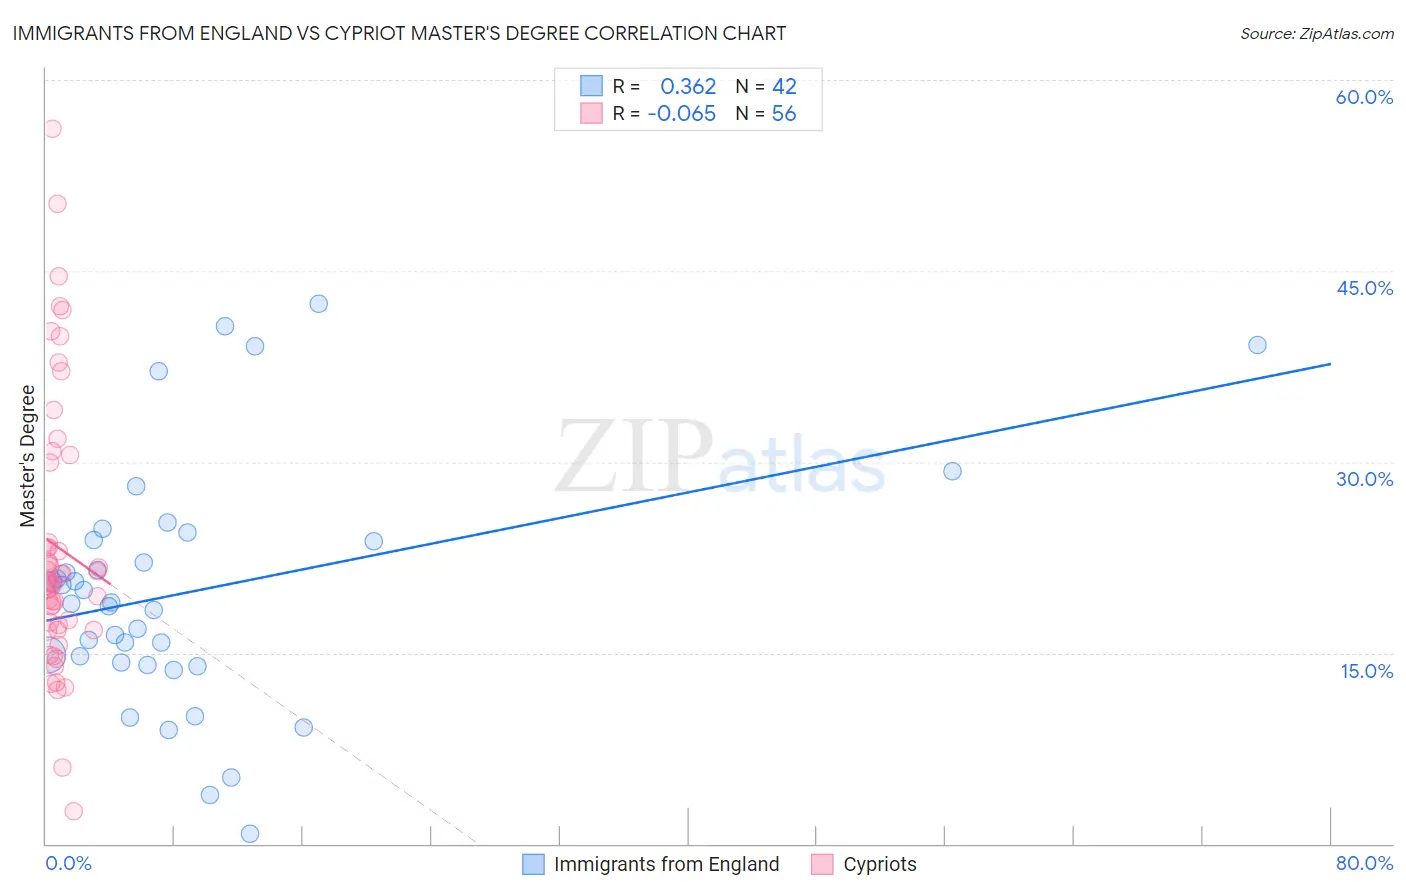
Immigrants from England vs Cypriot Master's Degree Correlation Chart
The statistical analysis conducted on geographies consisting of 391,825,279 people shows a mild positive correlation between the proportion of Immigrants from England and percentage of population with at least master's degree education in the United States with a correlation coefficient (R) of 0.362 and weighted average of 17.0%. Similarly, the statistical analysis conducted on geographies consisting of 61,862,826 people shows a slight negative correlation between the proportion of Cypriots and percentage of population with at least master's degree education in the United States with a correlation coefficient (R) of -0.065 and weighted average of 21.8%, a difference of 27.8%.
Master's Degree Correlation Summary
| Measurement | Immigrants from England | Cypriot |
| Minimum | 0.79% | 2.5% |
| Maximum | 42.5% | 56.1% |
| Range | 41.7% | 53.6% |
| Mean | 19.9% | 23.3% |
| Median | 18.9% | 20.5% |
| Interquartile 25% (IQ1) | 14.3% | 17.0% |
| Interquartile 75% (IQ3) | 23.9% | 26.8% |
| Interquartile Range (IQR) | 9.6% | 9.8% |
| Standard Deviation (Sample) | 9.6% | 10.7% |
| Standard Deviation (Population) | 9.5% | 10.6% |
Similar Demographics by Master's Degree
Demographics Similar to Immigrants from England by Master's Degree
In terms of master's degree, the demographic groups most similar to Immigrants from England are Immigrants from Ukraine (17.0%, a difference of 0.10%), Laotian (17.0%, a difference of 0.15%), Immigrants from Northern Africa (17.1%, a difference of 0.16%), Immigrants from Morocco (17.1%, a difference of 0.19%), and Albanian (17.0%, a difference of 0.36%).
| Demographics | Rating | Rank | Master's Degree |
| Immigrants | Egypt | 99.1 /100 | #90 | Exceptional 17.2% |
| Romanians | 99.1 /100 | #91 | Exceptional 17.2% |
| Immigrants | North America | 99.1 /100 | #92 | Exceptional 17.2% |
| Immigrants | Italy | 99.1 /100 | #93 | Exceptional 17.2% |
| Ugandans | 99.0 /100 | #94 | Exceptional 17.1% |
| Immigrants | Morocco | 98.9 /100 | #95 | Exceptional 17.1% |
| Immigrants | Northern Africa | 98.9 /100 | #96 | Exceptional 17.1% |
| Immigrants | England | 98.8 /100 | #97 | Exceptional 17.0% |
| Immigrants | Ukraine | 98.8 /100 | #98 | Exceptional 17.0% |
| Laotians | 98.8 /100 | #99 | Exceptional 17.0% |
| Albanians | 98.7 /100 | #100 | Exceptional 17.0% |
| Immigrants | Nepal | 98.6 /100 | #101 | Exceptional 17.0% |
| Chileans | 98.6 /100 | #102 | Exceptional 16.9% |
| Alsatians | 98.4 /100 | #103 | Exceptional 16.9% |
| Ukrainians | 98.3 /100 | #104 | Exceptional 16.9% |
Demographics Similar to Cypriots by Master's Degree
In terms of master's degree, the demographic groups most similar to Cypriots are Thai (21.7%, a difference of 0.34%), Immigrants from Iran (21.6%, a difference of 0.75%), Iranian (22.3%, a difference of 2.2%), Immigrants from India (22.3%, a difference of 2.4%), and Immigrants from China (21.2%, a difference of 2.9%).
| Demographics | Rating | Rank | Master's Degree |
| Immigrants | Singapore | 100.0 /100 | #1 | Exceptional 23.4% |
| Filipinos | 100.0 /100 | #2 | Exceptional 23.4% |
| Immigrants | Israel | 100.0 /100 | #3 | Exceptional 22.6% |
| Okinawans | 100.0 /100 | #4 | Exceptional 22.6% |
| Immigrants | Taiwan | 100.0 /100 | #5 | Exceptional 22.5% |
| Immigrants | India | 100.0 /100 | #6 | Exceptional 22.3% |
| Iranians | 100.0 /100 | #7 | Exceptional 22.3% |
| Cypriots | 100.0 /100 | #8 | Exceptional 21.8% |
| Thais | 100.0 /100 | #9 | Exceptional 21.7% |
| Immigrants | Iran | 100.0 /100 | #10 | Exceptional 21.6% |
| Immigrants | China | 100.0 /100 | #11 | Exceptional 21.2% |
| Eastern Europeans | 100.0 /100 | #12 | Exceptional 21.1% |
| Immigrants | Australia | 100.0 /100 | #13 | Exceptional 20.9% |
| Immigrants | Switzerland | 100.0 /100 | #14 | Exceptional 20.9% |
| Immigrants | Eastern Asia | 100.0 /100 | #15 | Exceptional 20.8% |