Immigrants from Greece vs Trinidadian and Tobagonian 9th Grade
COMPARE
Immigrants from Greece
Trinidadian and Tobagonian
9th Grade
9th Grade Comparison
Immigrants from Greece
Trinidadians and Tobagonians
95.2%
9TH GRADE
84.6/ 100
METRIC RATING
142nd/ 347
METRIC RANK
93.7%
9TH GRADE
0.1/ 100
METRIC RATING
279th/ 347
METRIC RANK
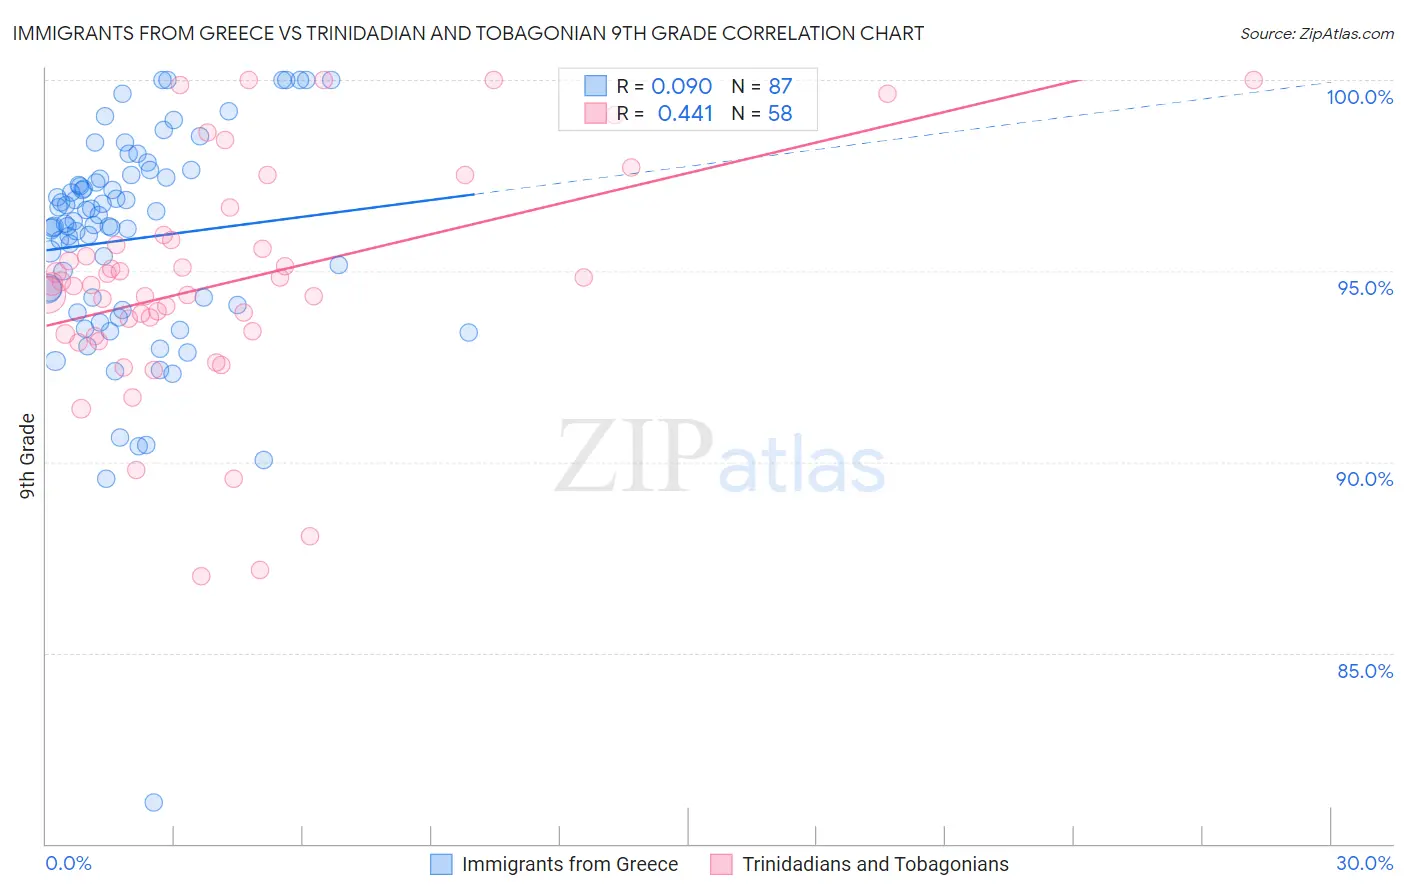
Immigrants from Greece vs Trinidadian and Tobagonian 9th Grade Correlation Chart
The statistical analysis conducted on geographies consisting of 216,879,847 people shows a slight positive correlation between the proportion of Immigrants from Greece and percentage of population with at least 9th grade education in the United States with a correlation coefficient (R) of 0.090 and weighted average of 95.2%. Similarly, the statistical analysis conducted on geographies consisting of 219,881,170 people shows a moderate positive correlation between the proportion of Trinidadians and Tobagonians and percentage of population with at least 9th grade education in the United States with a correlation coefficient (R) of 0.441 and weighted average of 93.7%, a difference of 1.6%.
9th Grade Correlation Summary
| Measurement | Immigrants from Greece | Trinidadian and Tobagonian |
| Minimum | 81.1% | 87.0% |
| Maximum | 100.0% | 100.0% |
| Range | 18.9% | 13.0% |
| Mean | 95.8% | 94.7% |
| Median | 96.2% | 94.6% |
| Interquartile 25% (IQ1) | 94.1% | 93.3% |
| Interquartile 75% (IQ3) | 97.4% | 95.8% |
| Interquartile Range (IQR) | 3.3% | 2.5% |
| Standard Deviation (Sample) | 2.9% | 3.0% |
| Standard Deviation (Population) | 2.9% | 3.0% |
Similar Demographics by 9th Grade
Demographics Similar to Immigrants from Greece by 9th Grade
In terms of 9th grade, the demographic groups most similar to Immigrants from Greece are Spanish (95.2%, a difference of 0.0%), Immigrants from Taiwan (95.2%, a difference of 0.010%), Immigrants from Bosnia and Herzegovina (95.2%, a difference of 0.010%), Immigrants from Eastern Europe (95.2%, a difference of 0.020%), and Yup'ik (95.2%, a difference of 0.020%).
| Demographics | Rating | Rank | 9th Grade |
| Immigrants | Belarus | 88.9 /100 | #135 | Excellent 95.2% |
| Immigrants | Iran | 88.3 /100 | #136 | Excellent 95.2% |
| Hmong | 87.7 /100 | #137 | Excellent 95.2% |
| Immigrants | Russia | 86.6 /100 | #138 | Excellent 95.2% |
| Immigrants | Eastern Europe | 85.8 /100 | #139 | Excellent 95.2% |
| Immigrants | Taiwan | 85.3 /100 | #140 | Excellent 95.2% |
| Immigrants | Bosnia and Herzegovina | 85.2 /100 | #141 | Excellent 95.2% |
| Immigrants | Greece | 84.6 /100 | #142 | Excellent 95.2% |
| Spanish | 84.4 /100 | #143 | Excellent 95.2% |
| Yup'ik | 83.3 /100 | #144 | Excellent 95.2% |
| Pueblo | 82.2 /100 | #145 | Excellent 95.1% |
| Immigrants | Sri Lanka | 82.1 /100 | #146 | Excellent 95.1% |
| Choctaw | 81.9 /100 | #147 | Excellent 95.1% |
| Immigrants | Jordan | 81.2 /100 | #148 | Excellent 95.1% |
| Immigrants | Korea | 79.6 /100 | #149 | Good 95.1% |
Demographics Similar to Trinidadians and Tobagonians by 9th Grade
In terms of 9th grade, the demographic groups most similar to Trinidadians and Tobagonians are Immigrants from Philippines (93.7%, a difference of 0.060%), Immigrants from Eritrea (93.7%, a difference of 0.060%), West Indian (93.7%, a difference of 0.070%), Immigrants from Colombia (93.8%, a difference of 0.080%), and Taiwanese (93.6%, a difference of 0.080%).
| Demographics | Rating | Rank | 9th Grade |
| Immigrants | Western Africa | 0.2 /100 | #272 | Tragic 93.8% |
| Immigrants | South America | 0.2 /100 | #273 | Tragic 93.8% |
| Peruvians | 0.2 /100 | #274 | Tragic 93.8% |
| Immigrants | Colombia | 0.2 /100 | #275 | Tragic 93.8% |
| West Indians | 0.2 /100 | #276 | Tragic 93.7% |
| Immigrants | Philippines | 0.1 /100 | #277 | Tragic 93.7% |
| Immigrants | Eritrea | 0.1 /100 | #278 | Tragic 93.7% |
| Trinidadians and Tobagonians | 0.1 /100 | #279 | Tragic 93.7% |
| Taiwanese | 0.1 /100 | #280 | Tragic 93.6% |
| Immigrants | Trinidad and Tobago | 0.1 /100 | #281 | Tragic 93.6% |
| Malaysians | 0.0 /100 | #282 | Tragic 93.5% |
| Barbadians | 0.0 /100 | #283 | Tragic 93.5% |
| Bangladeshis | 0.0 /100 | #284 | Tragic 93.4% |
| Immigrants | Peru | 0.0 /100 | #285 | Tragic 93.4% |
| Immigrants | Barbados | 0.0 /100 | #286 | Tragic 93.4% |