Japanese vs Immigrants from Uruguay Master's Degree
COMPARE
Japanese
Immigrants from Uruguay
Master's Degree
Master's Degree Comparison
Japanese
Immigrants from Uruguay
12.5%
MASTER'S DEGREE
0.6/ 100
METRIC RATING
259th/ 347
METRIC RANK
15.0%
MASTER'S DEGREE
52.8/ 100
METRIC RATING
172nd/ 347
METRIC RANK
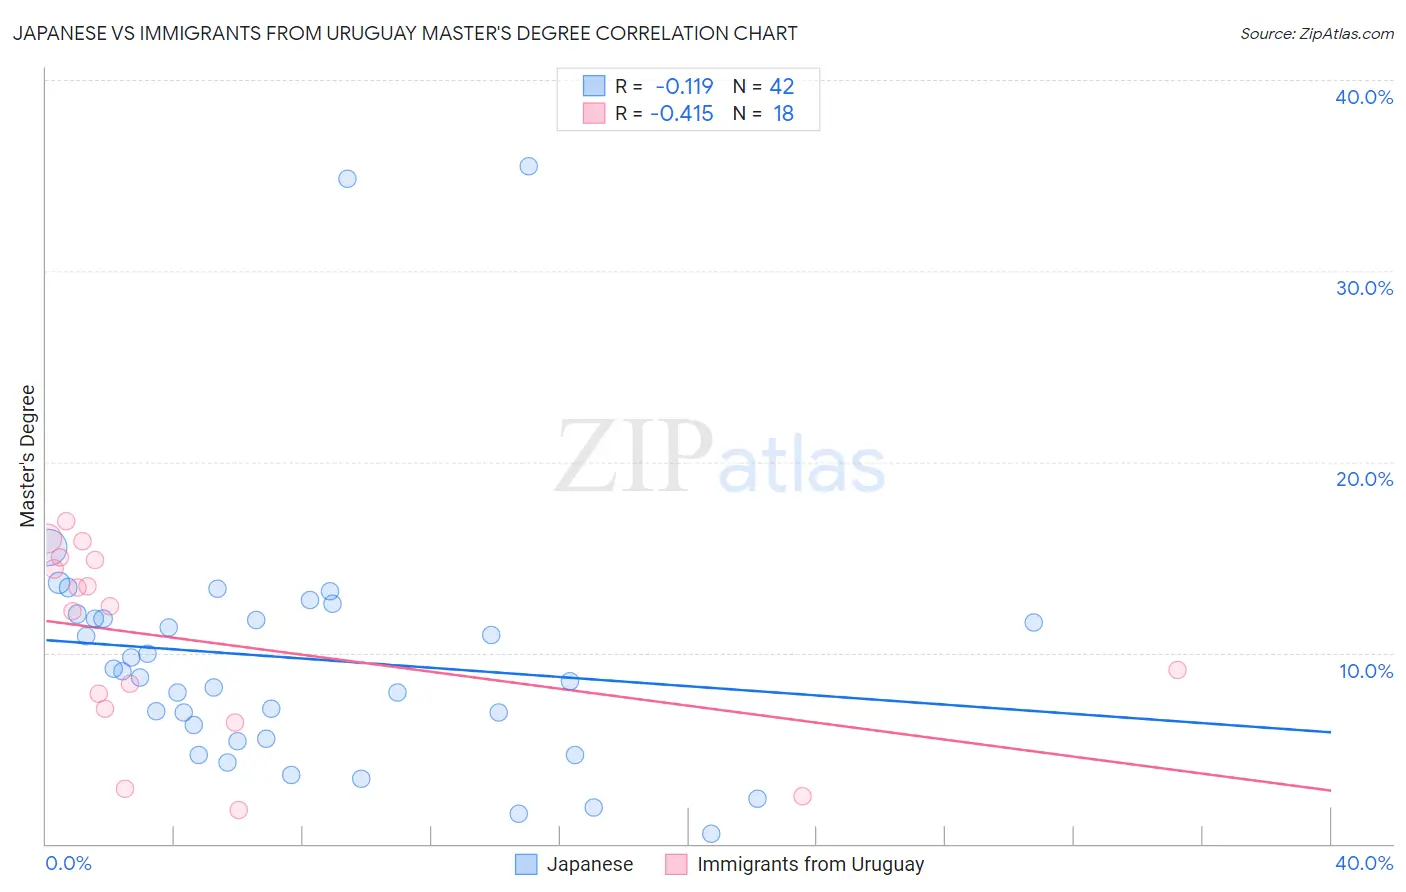
Japanese vs Immigrants from Uruguay Master's Degree Correlation Chart
The statistical analysis conducted on geographies consisting of 249,128,490 people shows a poor negative correlation between the proportion of Japanese and percentage of population with at least master's degree education in the United States with a correlation coefficient (R) of -0.119 and weighted average of 12.5%. Similarly, the statistical analysis conducted on geographies consisting of 133,247,285 people shows a moderate negative correlation between the proportion of Immigrants from Uruguay and percentage of population with at least master's degree education in the United States with a correlation coefficient (R) of -0.415 and weighted average of 15.0%, a difference of 19.8%.
Master's Degree Correlation Summary
| Measurement | Japanese | Immigrants from Uruguay |
| Minimum | 0.51% | 1.8% |
| Maximum | 35.5% | 16.9% |
| Range | 35.0% | 15.1% |
| Mean | 9.7% | 10.6% |
| Median | 8.9% | 12.3% |
| Interquartile 25% (IQ1) | 5.5% | 7.1% |
| Interquartile 75% (IQ3) | 11.8% | 14.9% |
| Interquartile Range (IQR) | 6.3% | 7.8% |
| Standard Deviation (Sample) | 6.9% | 5.0% |
| Standard Deviation (Population) | 6.8% | 4.8% |
Similar Demographics by Master's Degree
Demographics Similar to Japanese by Master's Degree
In terms of master's degree, the demographic groups most similar to Japanese are Dominican (12.5%, a difference of 0.010%), Tongan (12.5%, a difference of 0.040%), Immigrants from Liberia (12.5%, a difference of 0.090%), Nicaraguan (12.5%, a difference of 0.23%), and Central American Indian (12.4%, a difference of 0.46%).
| Demographics | Rating | Rank | Master's Degree |
| French American Indians | 1.0 /100 | #252 | Tragic 12.7% |
| Immigrants | Dominica | 0.8 /100 | #253 | Tragic 12.6% |
| Indonesians | 0.8 /100 | #254 | Tragic 12.6% |
| Immigrants | Congo | 0.8 /100 | #255 | Tragic 12.6% |
| Immigrants | Portugal | 0.8 /100 | #256 | Tragic 12.6% |
| Osage | 0.7 /100 | #257 | Tragic 12.6% |
| Immigrants | Liberia | 0.6 /100 | #258 | Tragic 12.5% |
| Japanese | 0.6 /100 | #259 | Tragic 12.5% |
| Dominicans | 0.6 /100 | #260 | Tragic 12.5% |
| Tongans | 0.6 /100 | #261 | Tragic 12.5% |
| Nicaraguans | 0.6 /100 | #262 | Tragic 12.5% |
| Central American Indians | 0.5 /100 | #263 | Tragic 12.4% |
| Belizeans | 0.5 /100 | #264 | Tragic 12.4% |
| Immigrants | Fiji | 0.5 /100 | #265 | Tragic 12.4% |
| Bahamians | 0.5 /100 | #266 | Tragic 12.4% |
Demographics Similar to Immigrants from Uruguay by Master's Degree
In terms of master's degree, the demographic groups most similar to Immigrants from Uruguay are Costa Rican (15.0%, a difference of 0.040%), Immigrants from Ghana (15.0%, a difference of 0.10%), Slovak (14.9%, a difference of 0.36%), Immigrants from Peru (14.9%, a difference of 0.40%), and Irish (15.0%, a difference of 0.46%).
| Demographics | Rating | Rank | Master's Degree |
| Immigrants | Kenya | 66.6 /100 | #165 | Good 15.3% |
| Swedes | 66.1 /100 | #166 | Good 15.2% |
| Senegalese | 65.6 /100 | #167 | Good 15.2% |
| Immigrants | North Macedonia | 64.5 /100 | #168 | Good 15.2% |
| Scottish | 62.7 /100 | #169 | Good 15.2% |
| Irish | 56.3 /100 | #170 | Average 15.0% |
| Immigrants | Ghana | 53.6 /100 | #171 | Average 15.0% |
| Immigrants | Uruguay | 52.8 /100 | #172 | Average 15.0% |
| Costa Ricans | 52.5 /100 | #173 | Average 15.0% |
| Slovaks | 50.0 /100 | #174 | Average 14.9% |
| Immigrants | Peru | 49.6 /100 | #175 | Average 14.9% |
| Nigerians | 48.6 /100 | #176 | Average 14.9% |
| Immigrants | Colombia | 48.3 /100 | #177 | Average 14.9% |
| English | 45.0 /100 | #178 | Average 14.8% |
| Immigrants | Iraq | 41.3 /100 | #179 | Average 14.8% |