Japanese vs Immigrants from Poland Master's Degree
COMPARE
Japanese
Immigrants from Poland
Master's Degree
Master's Degree Comparison
Japanese
Immigrants from Poland
12.5%
MASTER'S DEGREE
0.6/ 100
METRIC RATING
259th/ 347
METRIC RANK
15.4%
MASTER'S DEGREE
71.5/ 100
METRIC RATING
158th/ 347
METRIC RANK
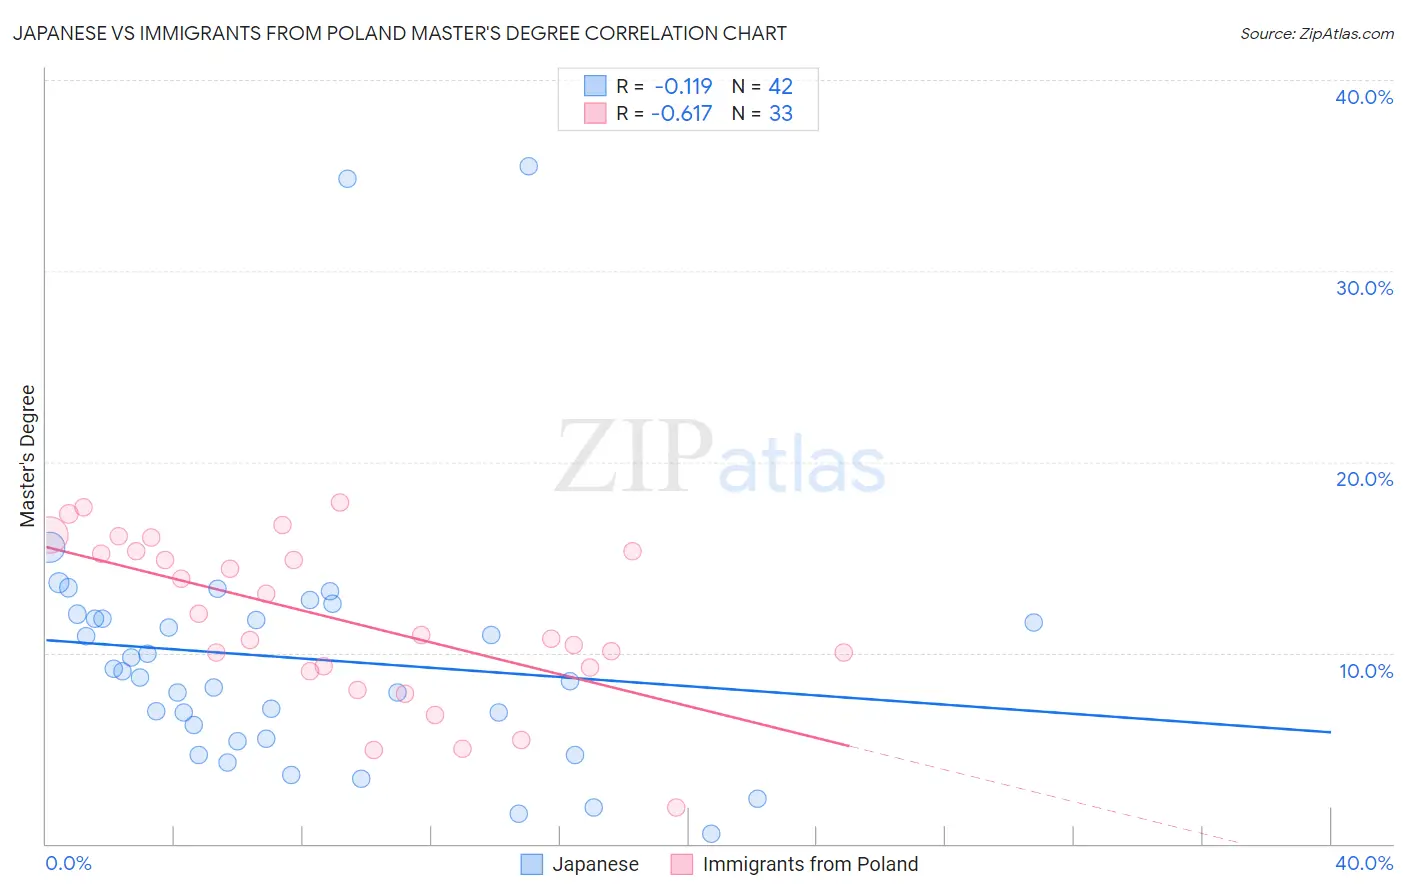
Japanese vs Immigrants from Poland Master's Degree Correlation Chart
The statistical analysis conducted on geographies consisting of 249,128,490 people shows a poor negative correlation between the proportion of Japanese and percentage of population with at least master's degree education in the United States with a correlation coefficient (R) of -0.119 and weighted average of 12.5%. Similarly, the statistical analysis conducted on geographies consisting of 304,812,257 people shows a significant negative correlation between the proportion of Immigrants from Poland and percentage of population with at least master's degree education in the United States with a correlation coefficient (R) of -0.617 and weighted average of 15.4%, a difference of 22.9%.
Master's Degree Correlation Summary
| Measurement | Japanese | Immigrants from Poland |
| Minimum | 0.51% | 1.9% |
| Maximum | 35.5% | 17.9% |
| Range | 35.0% | 16.0% |
| Mean | 9.7% | 11.7% |
| Median | 8.9% | 10.9% |
| Interquartile 25% (IQ1) | 5.5% | 9.1% |
| Interquartile 75% (IQ3) | 11.8% | 15.3% |
| Interquartile Range (IQR) | 6.3% | 6.2% |
| Standard Deviation (Sample) | 6.9% | 4.2% |
| Standard Deviation (Population) | 6.8% | 4.2% |
Similar Demographics by Master's Degree
Demographics Similar to Japanese by Master's Degree
In terms of master's degree, the demographic groups most similar to Japanese are Dominican (12.5%, a difference of 0.010%), Tongan (12.5%, a difference of 0.040%), Immigrants from Liberia (12.5%, a difference of 0.090%), Nicaraguan (12.5%, a difference of 0.23%), and Central American Indian (12.4%, a difference of 0.46%).
| Demographics | Rating | Rank | Master's Degree |
| French American Indians | 1.0 /100 | #252 | Tragic 12.7% |
| Immigrants | Dominica | 0.8 /100 | #253 | Tragic 12.6% |
| Indonesians | 0.8 /100 | #254 | Tragic 12.6% |
| Immigrants | Congo | 0.8 /100 | #255 | Tragic 12.6% |
| Immigrants | Portugal | 0.8 /100 | #256 | Tragic 12.6% |
| Osage | 0.7 /100 | #257 | Tragic 12.6% |
| Immigrants | Liberia | 0.6 /100 | #258 | Tragic 12.5% |
| Japanese | 0.6 /100 | #259 | Tragic 12.5% |
| Dominicans | 0.6 /100 | #260 | Tragic 12.5% |
| Tongans | 0.6 /100 | #261 | Tragic 12.5% |
| Nicaraguans | 0.6 /100 | #262 | Tragic 12.5% |
| Central American Indians | 0.5 /100 | #263 | Tragic 12.4% |
| Belizeans | 0.5 /100 | #264 | Tragic 12.4% |
| Immigrants | Fiji | 0.5 /100 | #265 | Tragic 12.4% |
| Bahamians | 0.5 /100 | #266 | Tragic 12.4% |
Demographics Similar to Immigrants from Poland by Master's Degree
In terms of master's degree, the demographic groups most similar to Immigrants from Poland are Immigrants from Cameroon (15.4%, a difference of 0.040%), Luxembourger (15.3%, a difference of 0.070%), Kenyan (15.3%, a difference of 0.18%), Bermudan (15.4%, a difference of 0.39%), and Sudanese (15.3%, a difference of 0.41%).
| Demographics | Rating | Rank | Master's Degree |
| Iraqis | 77.3 /100 | #151 | Good 15.5% |
| Slavs | 77.0 /100 | #152 | Good 15.5% |
| Icelanders | 76.8 /100 | #153 | Good 15.5% |
| Immigrants | South America | 76.3 /100 | #154 | Good 15.5% |
| Immigrants | Bangladesh | 76.1 /100 | #155 | Good 15.5% |
| Bermudans | 73.9 /100 | #156 | Good 15.4% |
| Immigrants | Cameroon | 71.7 /100 | #157 | Good 15.4% |
| Immigrants | Poland | 71.5 /100 | #158 | Good 15.4% |
| Luxembourgers | 71.0 /100 | #159 | Good 15.3% |
| Kenyans | 70.3 /100 | #160 | Good 15.3% |
| Sudanese | 68.7 /100 | #161 | Good 15.3% |
| Peruvians | 68.7 /100 | #162 | Good 15.3% |
| Uruguayans | 67.1 /100 | #163 | Good 15.3% |
| Colombians | 66.9 /100 | #164 | Good 15.3% |
| Immigrants | Kenya | 66.6 /100 | #165 | Good 15.3% |