British vs Immigrants from Uruguay Master's Degree
COMPARE
British
Immigrants from Uruguay
Master's Degree
Master's Degree Comparison
British
Immigrants from Uruguay
16.4%
MASTER'S DEGREE
95.6/ 100
METRIC RATING
122nd/ 347
METRIC RANK
15.0%
MASTER'S DEGREE
52.8/ 100
METRIC RATING
172nd/ 347
METRIC RANK
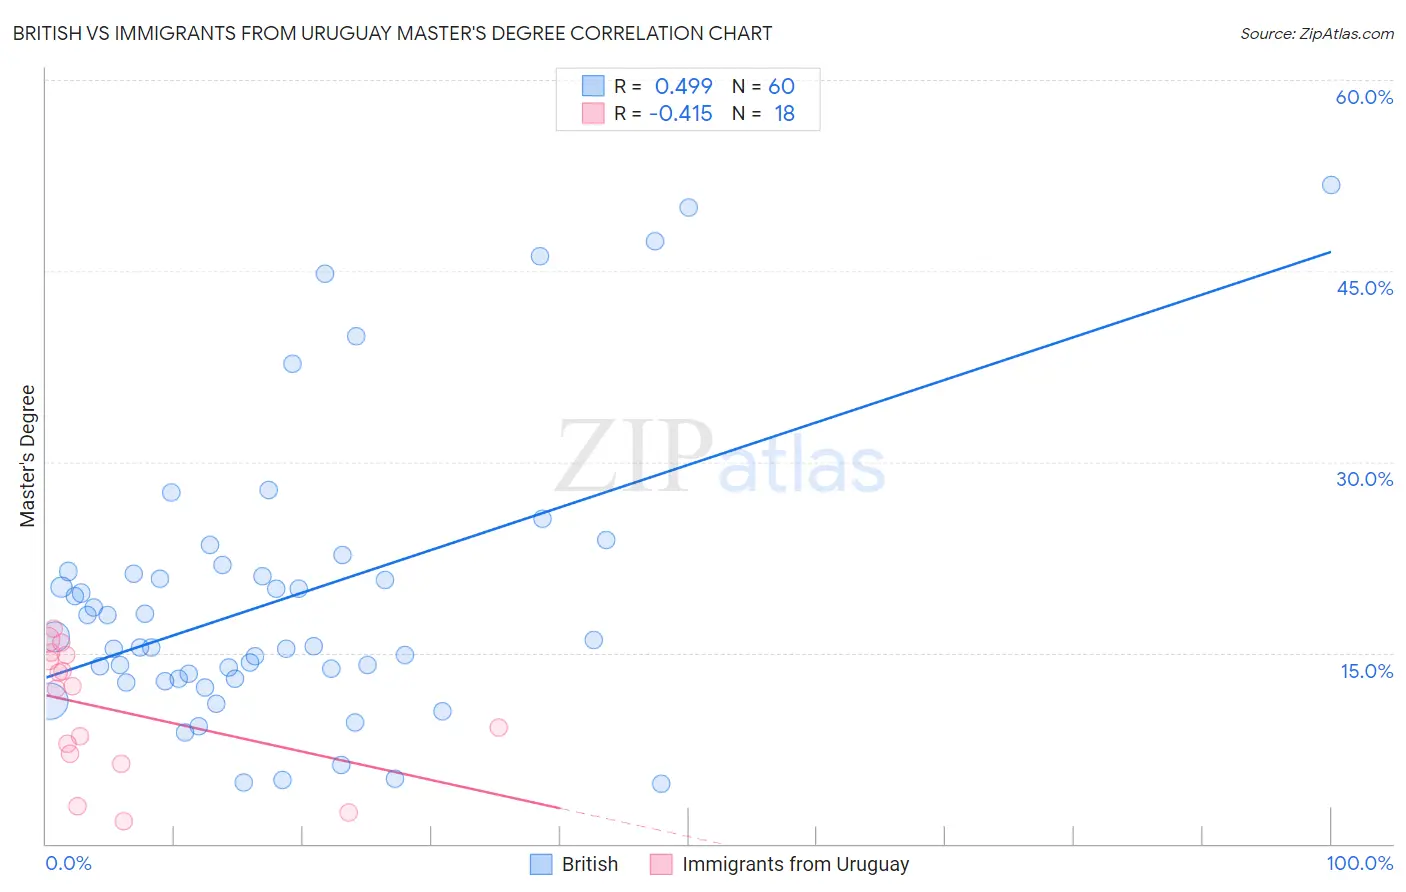
British vs Immigrants from Uruguay Master's Degree Correlation Chart
The statistical analysis conducted on geographies consisting of 531,094,529 people shows a moderate positive correlation between the proportion of British and percentage of population with at least master's degree education in the United States with a correlation coefficient (R) of 0.499 and weighted average of 16.4%. Similarly, the statistical analysis conducted on geographies consisting of 133,247,285 people shows a moderate negative correlation between the proportion of Immigrants from Uruguay and percentage of population with at least master's degree education in the United States with a correlation coefficient (R) of -0.415 and weighted average of 15.0%, a difference of 9.5%.
Master's Degree Correlation Summary
| Measurement | British | Immigrants from Uruguay |
| Minimum | 4.8% | 1.8% |
| Maximum | 51.7% | 16.9% |
| Range | 47.0% | 15.1% |
| Mean | 19.2% | 10.6% |
| Median | 15.7% | 12.3% |
| Interquartile 25% (IQ1) | 13.0% | 7.1% |
| Interquartile 75% (IQ3) | 21.3% | 14.9% |
| Interquartile Range (IQR) | 8.4% | 7.8% |
| Standard Deviation (Sample) | 11.1% | 5.0% |
| Standard Deviation (Population) | 11.0% | 4.8% |
Similar Demographics by Master's Degree
Demographics Similar to British by Master's Degree
In terms of master's degree, the demographic groups most similar to British are Croatian (16.4%, a difference of 0.010%), Immigrants from Eritrea (16.4%, a difference of 0.080%), Italian (16.4%, a difference of 0.16%), Immigrants from Eastern Africa (16.3%, a difference of 0.27%), and Afghan (16.5%, a difference of 0.43%).
| Demographics | Rating | Rank | Master's Degree |
| Immigrants | Uganda | 97.3 /100 | #115 | Exceptional 16.6% |
| Immigrants | Southern Europe | 97.2 /100 | #116 | Exceptional 16.6% |
| Immigrants | Moldova | 97.2 /100 | #117 | Exceptional 16.6% |
| Brazilians | 96.8 /100 | #118 | Exceptional 16.5% |
| Jordanians | 96.5 /100 | #119 | Exceptional 16.5% |
| Lebanese | 96.4 /100 | #120 | Exceptional 16.5% |
| Afghans | 96.2 /100 | #121 | Exceptional 16.5% |
| British | 95.6 /100 | #122 | Exceptional 16.4% |
| Croatians | 95.6 /100 | #123 | Exceptional 16.4% |
| Immigrants | Eritrea | 95.5 /100 | #124 | Exceptional 16.4% |
| Italians | 95.4 /100 | #125 | Exceptional 16.4% |
| Immigrants | Eastern Africa | 95.2 /100 | #126 | Exceptional 16.3% |
| Palestinians | 94.8 /100 | #127 | Exceptional 16.3% |
| Immigrants | Sierra Leone | 94.7 /100 | #128 | Exceptional 16.3% |
| Immigrants | Syria | 93.3 /100 | #129 | Exceptional 16.2% |
Demographics Similar to Immigrants from Uruguay by Master's Degree
In terms of master's degree, the demographic groups most similar to Immigrants from Uruguay are Costa Rican (15.0%, a difference of 0.040%), Immigrants from Ghana (15.0%, a difference of 0.10%), Slovak (14.9%, a difference of 0.36%), Immigrants from Peru (14.9%, a difference of 0.40%), and Irish (15.0%, a difference of 0.46%).
| Demographics | Rating | Rank | Master's Degree |
| Immigrants | Kenya | 66.6 /100 | #165 | Good 15.3% |
| Swedes | 66.1 /100 | #166 | Good 15.2% |
| Senegalese | 65.6 /100 | #167 | Good 15.2% |
| Immigrants | North Macedonia | 64.5 /100 | #168 | Good 15.2% |
| Scottish | 62.7 /100 | #169 | Good 15.2% |
| Irish | 56.3 /100 | #170 | Average 15.0% |
| Immigrants | Ghana | 53.6 /100 | #171 | Average 15.0% |
| Immigrants | Uruguay | 52.8 /100 | #172 | Average 15.0% |
| Costa Ricans | 52.5 /100 | #173 | Average 15.0% |
| Slovaks | 50.0 /100 | #174 | Average 14.9% |
| Immigrants | Peru | 49.6 /100 | #175 | Average 14.9% |
| Nigerians | 48.6 /100 | #176 | Average 14.9% |
| Immigrants | Colombia | 48.3 /100 | #177 | Average 14.9% |
| English | 45.0 /100 | #178 | Average 14.8% |
| Immigrants | Iraq | 41.3 /100 | #179 | Average 14.8% |