Japanese vs Korean Master's Degree
COMPARE
Japanese
Korean
Master's Degree
Master's Degree Comparison
Japanese
Koreans
12.5%
MASTER'S DEGREE
0.6/ 100
METRIC RATING
259th/ 347
METRIC RANK
14.0%
MASTER'S DEGREE
12.7/ 100
METRIC RATING
221st/ 347
METRIC RANK
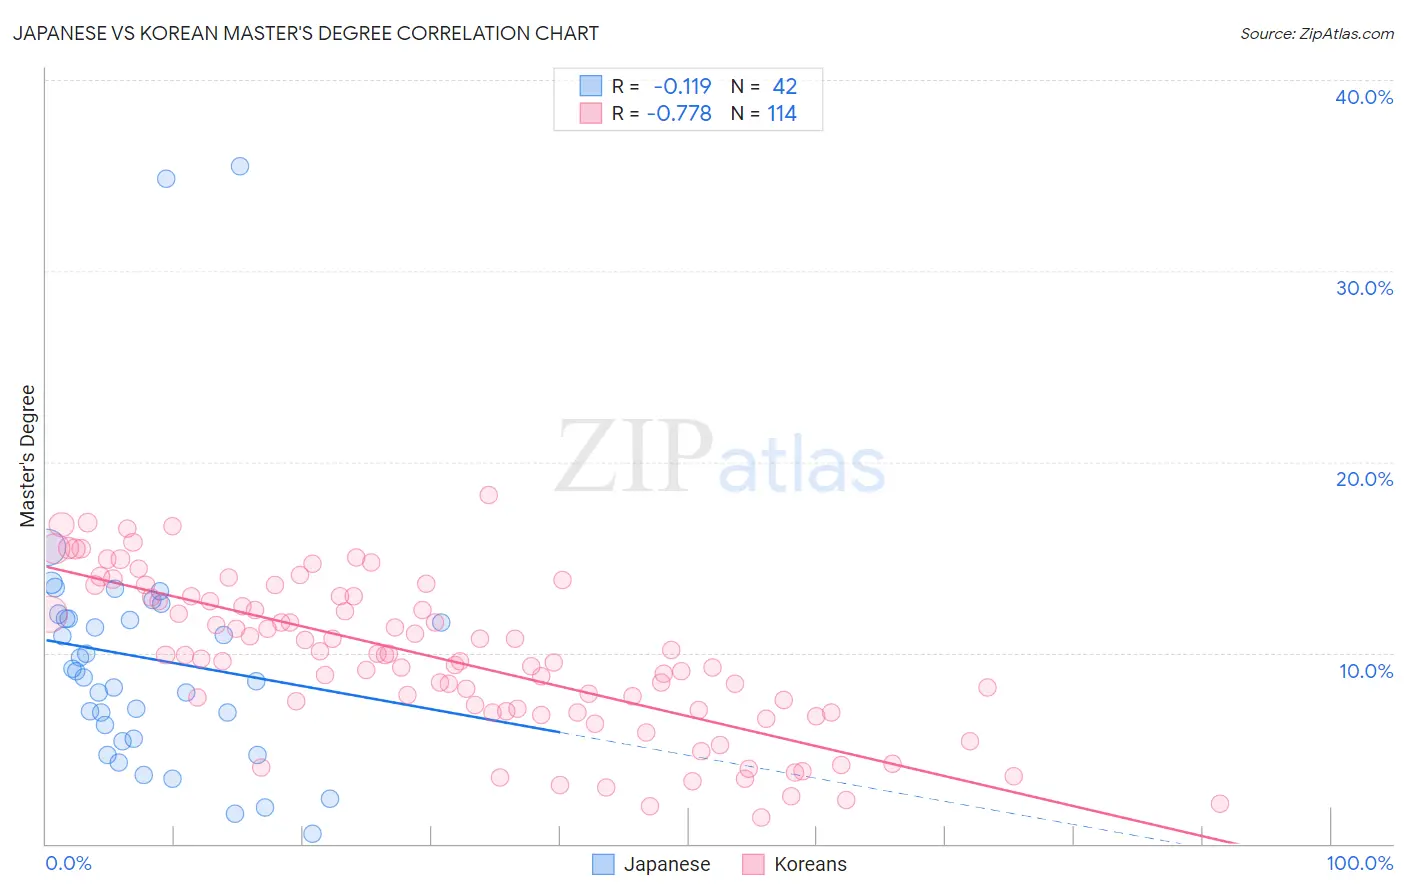
Japanese vs Korean Master's Degree Correlation Chart
The statistical analysis conducted on geographies consisting of 249,128,490 people shows a poor negative correlation between the proportion of Japanese and percentage of population with at least master's degree education in the United States with a correlation coefficient (R) of -0.119 and weighted average of 12.5%. Similarly, the statistical analysis conducted on geographies consisting of 510,607,877 people shows a strong negative correlation between the proportion of Koreans and percentage of population with at least master's degree education in the United States with a correlation coefficient (R) of -0.778 and weighted average of 14.0%, a difference of 12.0%.
Master's Degree Correlation Summary
| Measurement | Japanese | Korean |
| Minimum | 0.51% | 1.4% |
| Maximum | 35.5% | 18.3% |
| Range | 35.0% | 16.9% |
| Mean | 9.7% | 9.7% |
| Median | 8.9% | 9.8% |
| Interquartile 25% (IQ1) | 5.5% | 6.9% |
| Interquartile 75% (IQ3) | 11.8% | 12.9% |
| Interquartile Range (IQR) | 6.3% | 6.0% |
| Standard Deviation (Sample) | 6.9% | 4.0% |
| Standard Deviation (Population) | 6.8% | 4.0% |
Similar Demographics by Master's Degree
Demographics Similar to Japanese by Master's Degree
In terms of master's degree, the demographic groups most similar to Japanese are Dominican (12.5%, a difference of 0.010%), Tongan (12.5%, a difference of 0.040%), Immigrants from Liberia (12.5%, a difference of 0.090%), Nicaraguan (12.5%, a difference of 0.23%), and Central American Indian (12.4%, a difference of 0.46%).
| Demographics | Rating | Rank | Master's Degree |
| French American Indians | 1.0 /100 | #252 | Tragic 12.7% |
| Immigrants | Dominica | 0.8 /100 | #253 | Tragic 12.6% |
| Indonesians | 0.8 /100 | #254 | Tragic 12.6% |
| Immigrants | Congo | 0.8 /100 | #255 | Tragic 12.6% |
| Immigrants | Portugal | 0.8 /100 | #256 | Tragic 12.6% |
| Osage | 0.7 /100 | #257 | Tragic 12.6% |
| Immigrants | Liberia | 0.6 /100 | #258 | Tragic 12.5% |
| Japanese | 0.6 /100 | #259 | Tragic 12.5% |
| Dominicans | 0.6 /100 | #260 | Tragic 12.5% |
| Tongans | 0.6 /100 | #261 | Tragic 12.5% |
| Nicaraguans | 0.6 /100 | #262 | Tragic 12.5% |
| Central American Indians | 0.5 /100 | #263 | Tragic 12.4% |
| Belizeans | 0.5 /100 | #264 | Tragic 12.4% |
| Immigrants | Fiji | 0.5 /100 | #265 | Tragic 12.4% |
| Bahamians | 0.5 /100 | #266 | Tragic 12.4% |
Demographics Similar to Koreans by Master's Degree
In terms of master's degree, the demographic groups most similar to Koreans are Ecuadorian (14.0%, a difference of 0.030%), German (14.0%, a difference of 0.13%), Immigrants from South Eastern Asia (14.0%, a difference of 0.23%), Immigrants from Grenada (14.0%, a difference of 0.28%), and Norwegian (14.0%, a difference of 0.29%).
| Demographics | Rating | Rank | Master's Degree |
| Finns | 16.9 /100 | #214 | Poor 14.2% |
| Immigrants | Vietnam | 16.1 /100 | #215 | Poor 14.1% |
| Immigrants | Somalia | 15.8 /100 | #216 | Poor 14.1% |
| Immigrants | Trinidad and Tobago | 15.8 /100 | #217 | Poor 14.1% |
| French Canadians | 14.9 /100 | #218 | Poor 14.1% |
| Norwegians | 13.6 /100 | #219 | Poor 14.0% |
| Germans | 13.1 /100 | #220 | Poor 14.0% |
| Koreans | 12.7 /100 | #221 | Poor 14.0% |
| Ecuadorians | 12.6 /100 | #222 | Poor 14.0% |
| Immigrants | South Eastern Asia | 11.9 /100 | #223 | Poor 14.0% |
| Immigrants | Grenada | 11.8 /100 | #224 | Poor 14.0% |
| Portuguese | 11.2 /100 | #225 | Poor 13.9% |
| Immigrants | St. Vincent and the Grenadines | 11.0 /100 | #226 | Poor 13.9% |
| Immigrants | West Indies | 9.8 /100 | #227 | Tragic 13.9% |
| Whites/Caucasians | 9.1 /100 | #228 | Tragic 13.8% |