Japanese vs Immigrants from Western Africa Master's Degree
COMPARE
Japanese
Immigrants from Western Africa
Master's Degree
Master's Degree Comparison
Japanese
Immigrants from Western Africa
12.5%
MASTER'S DEGREE
0.6/ 100
METRIC RATING
259th/ 347
METRIC RANK
14.4%
MASTER'S DEGREE
24.9/ 100
METRIC RATING
202nd/ 347
METRIC RANK
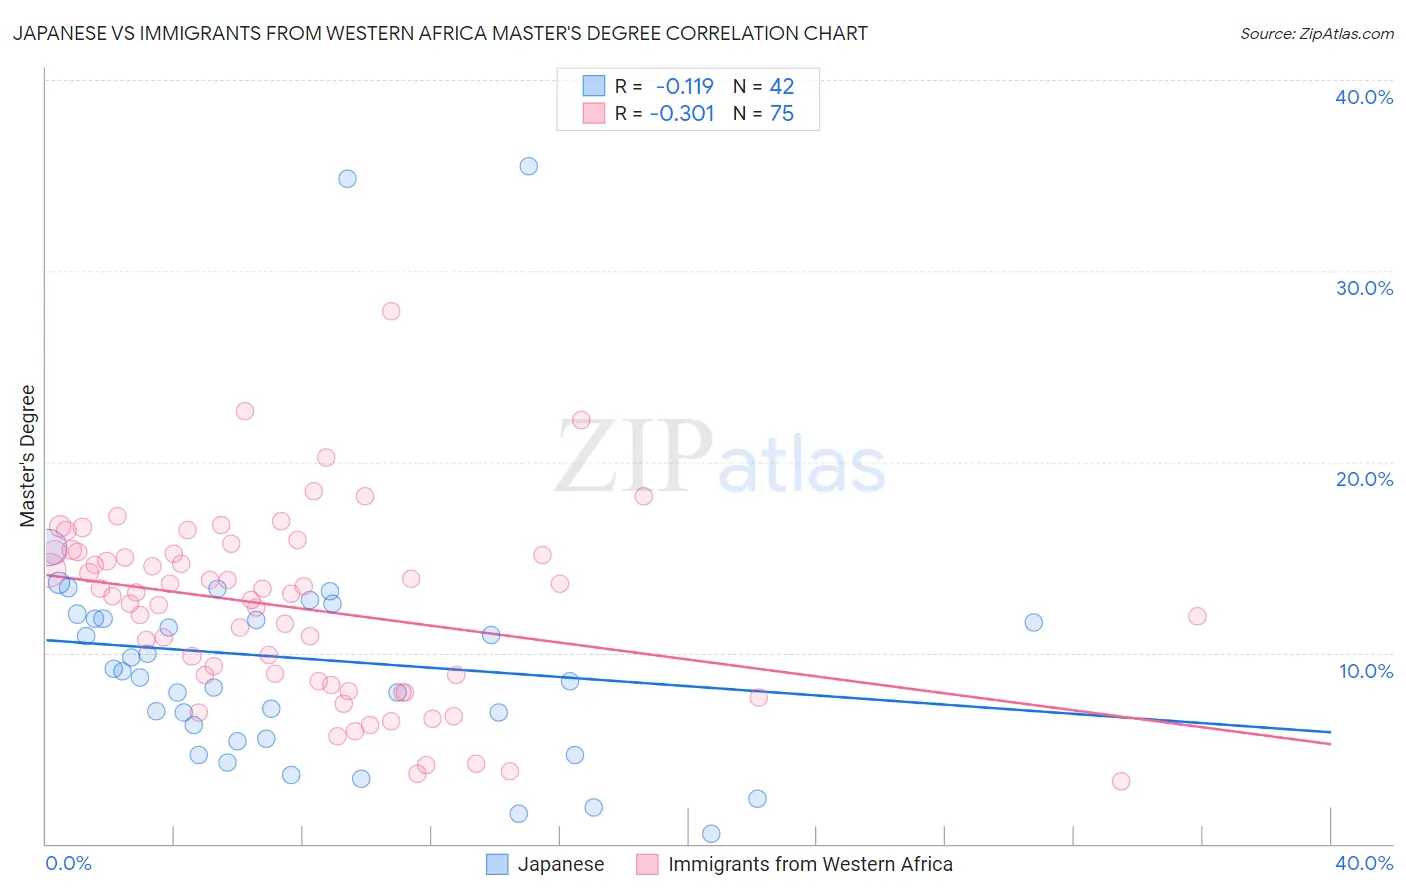
Japanese vs Immigrants from Western Africa Master's Degree Correlation Chart
The statistical analysis conducted on geographies consisting of 249,128,490 people shows a poor negative correlation between the proportion of Japanese and percentage of population with at least master's degree education in the United States with a correlation coefficient (R) of -0.119 and weighted average of 12.5%. Similarly, the statistical analysis conducted on geographies consisting of 357,742,220 people shows a mild negative correlation between the proportion of Immigrants from Western Africa and percentage of population with at least master's degree education in the United States with a correlation coefficient (R) of -0.301 and weighted average of 14.4%, a difference of 15.2%.
Master's Degree Correlation Summary
| Measurement | Japanese | Immigrants from Western Africa |
| Minimum | 0.51% | 3.3% |
| Maximum | 35.5% | 27.9% |
| Range | 35.0% | 24.6% |
| Mean | 9.7% | 12.4% |
| Median | 8.9% | 13.1% |
| Interquartile 25% (IQ1) | 5.5% | 8.5% |
| Interquartile 75% (IQ3) | 11.8% | 15.3% |
| Interquartile Range (IQR) | 6.3% | 6.8% |
| Standard Deviation (Sample) | 6.9% | 4.8% |
| Standard Deviation (Population) | 6.8% | 4.7% |
Similar Demographics by Master's Degree
Demographics Similar to Japanese by Master's Degree
In terms of master's degree, the demographic groups most similar to Japanese are Dominican (12.5%, a difference of 0.010%), Tongan (12.5%, a difference of 0.040%), Immigrants from Liberia (12.5%, a difference of 0.090%), Nicaraguan (12.5%, a difference of 0.23%), and Central American Indian (12.4%, a difference of 0.46%).
| Demographics | Rating | Rank | Master's Degree |
| French American Indians | 1.0 /100 | #252 | Tragic 12.7% |
| Immigrants | Dominica | 0.8 /100 | #253 | Tragic 12.6% |
| Indonesians | 0.8 /100 | #254 | Tragic 12.6% |
| Immigrants | Congo | 0.8 /100 | #255 | Tragic 12.6% |
| Immigrants | Portugal | 0.8 /100 | #256 | Tragic 12.6% |
| Osage | 0.7 /100 | #257 | Tragic 12.6% |
| Immigrants | Liberia | 0.6 /100 | #258 | Tragic 12.5% |
| Japanese | 0.6 /100 | #259 | Tragic 12.5% |
| Dominicans | 0.6 /100 | #260 | Tragic 12.5% |
| Tongans | 0.6 /100 | #261 | Tragic 12.5% |
| Nicaraguans | 0.6 /100 | #262 | Tragic 12.5% |
| Central American Indians | 0.5 /100 | #263 | Tragic 12.4% |
| Belizeans | 0.5 /100 | #264 | Tragic 12.4% |
| Immigrants | Fiji | 0.5 /100 | #265 | Tragic 12.4% |
| Bahamians | 0.5 /100 | #266 | Tragic 12.4% |
Demographics Similar to Immigrants from Western Africa by Master's Degree
In terms of master's degree, the demographic groups most similar to Immigrants from Western Africa are Scotch-Irish (14.4%, a difference of 0.010%), Panamanian (14.4%, a difference of 0.020%), Yugoslavian (14.4%, a difference of 0.11%), French (14.4%, a difference of 0.22%), and Trinidadian and Tobagonian (14.4%, a difference of 0.26%).
| Demographics | Rating | Rank | Master's Degree |
| Danes | 31.3 /100 | #195 | Fair 14.5% |
| Czechoslovakians | 29.9 /100 | #196 | Fair 14.5% |
| Belgians | 28.0 /100 | #197 | Fair 14.5% |
| West Indians | 27.4 /100 | #198 | Fair 14.5% |
| Immigrants | Armenia | 27.2 /100 | #199 | Fair 14.5% |
| Panamanians | 25.1 /100 | #200 | Fair 14.4% |
| Scotch-Irish | 25.0 /100 | #201 | Fair 14.4% |
| Immigrants | Western Africa | 24.9 /100 | #202 | Fair 14.4% |
| Yugoslavians | 24.3 /100 | #203 | Fair 14.4% |
| French | 23.7 /100 | #204 | Fair 14.4% |
| Trinidadians and Tobagonians | 23.5 /100 | #205 | Fair 14.4% |
| Scandinavians | 23.3 /100 | #206 | Fair 14.4% |
| Immigrants | Bosnia and Herzegovina | 22.0 /100 | #207 | Fair 14.3% |
| Immigrants | Barbados | 20.5 /100 | #208 | Fair 14.3% |
| Immigrants | Panama | 20.0 /100 | #209 | Fair 14.3% |