Ecuadorian vs Immigrants from Uruguay Master's Degree
COMPARE
Ecuadorian
Immigrants from Uruguay
Master's Degree
Master's Degree Comparison
Ecuadorians
Immigrants from Uruguay
14.0%
MASTER'S DEGREE
12.6/ 100
METRIC RATING
222nd/ 347
METRIC RANK
15.0%
MASTER'S DEGREE
52.8/ 100
METRIC RATING
172nd/ 347
METRIC RANK
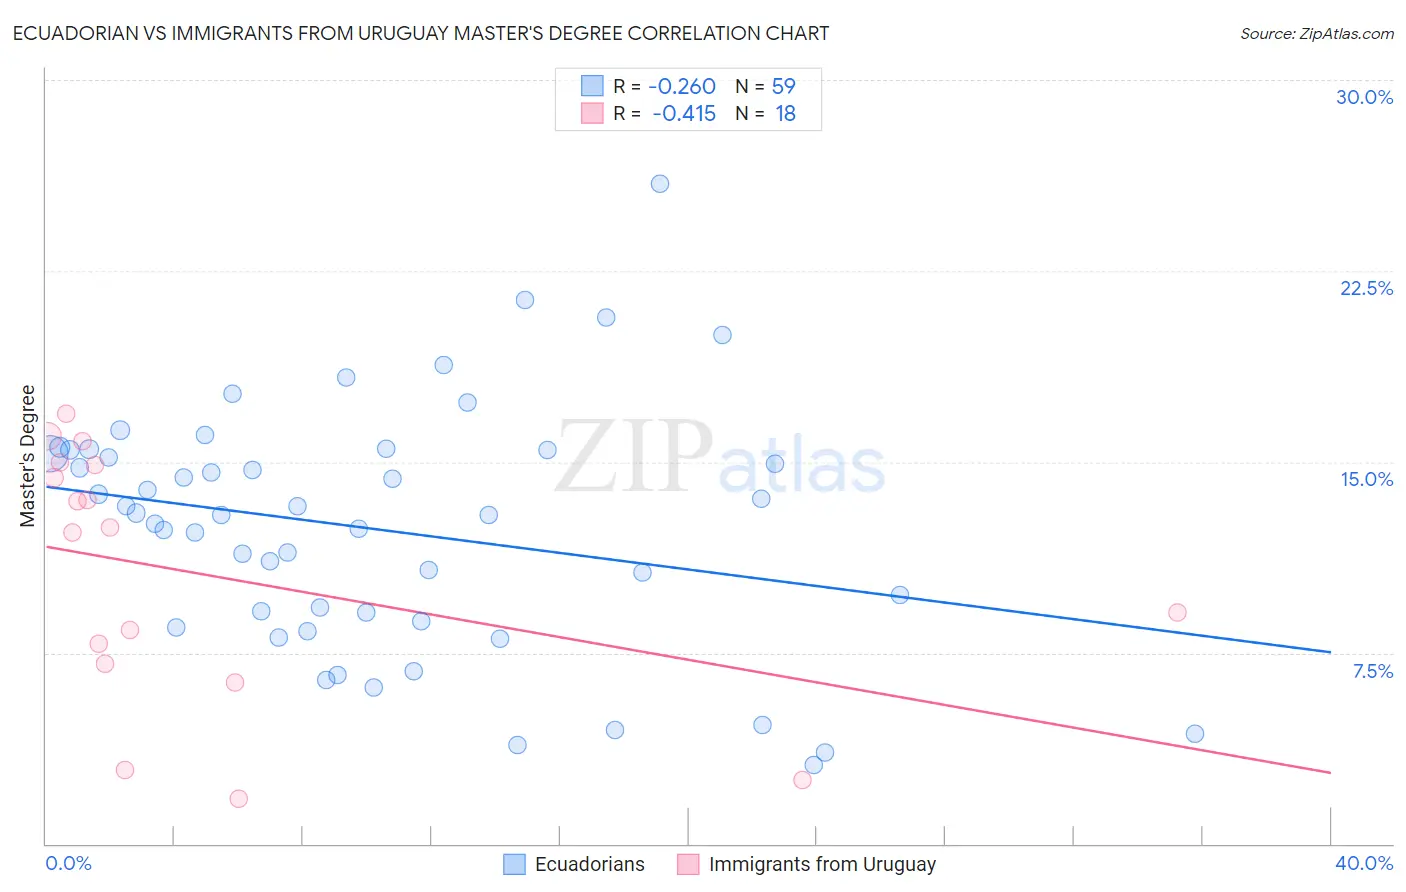
Ecuadorian vs Immigrants from Uruguay Master's Degree Correlation Chart
The statistical analysis conducted on geographies consisting of 317,754,376 people shows a weak negative correlation between the proportion of Ecuadorians and percentage of population with at least master's degree education in the United States with a correlation coefficient (R) of -0.260 and weighted average of 14.0%. Similarly, the statistical analysis conducted on geographies consisting of 133,247,285 people shows a moderate negative correlation between the proportion of Immigrants from Uruguay and percentage of population with at least master's degree education in the United States with a correlation coefficient (R) of -0.415 and weighted average of 15.0%, a difference of 7.0%.
Master's Degree Correlation Summary
| Measurement | Ecuadorian | Immigrants from Uruguay |
| Minimum | 3.1% | 1.8% |
| Maximum | 25.9% | 16.9% |
| Range | 22.8% | 15.1% |
| Mean | 12.3% | 10.6% |
| Median | 12.9% | 12.3% |
| Interquartile 25% (IQ1) | 8.8% | 7.1% |
| Interquartile 75% (IQ3) | 15.5% | 14.9% |
| Interquartile Range (IQR) | 6.7% | 7.8% |
| Standard Deviation (Sample) | 4.8% | 5.0% |
| Standard Deviation (Population) | 4.8% | 4.8% |
Similar Demographics by Master's Degree
Demographics Similar to Ecuadorians by Master's Degree
In terms of master's degree, the demographic groups most similar to Ecuadorians are Korean (14.0%, a difference of 0.030%), German (14.0%, a difference of 0.17%), Immigrants from South Eastern Asia (14.0%, a difference of 0.20%), Immigrants from Grenada (14.0%, a difference of 0.25%), and Norwegian (14.0%, a difference of 0.32%).
| Demographics | Rating | Rank | Master's Degree |
| Immigrants | Vietnam | 16.1 /100 | #215 | Poor 14.1% |
| Immigrants | Somalia | 15.8 /100 | #216 | Poor 14.1% |
| Immigrants | Trinidad and Tobago | 15.8 /100 | #217 | Poor 14.1% |
| French Canadians | 14.9 /100 | #218 | Poor 14.1% |
| Norwegians | 13.6 /100 | #219 | Poor 14.0% |
| Germans | 13.1 /100 | #220 | Poor 14.0% |
| Koreans | 12.7 /100 | #221 | Poor 14.0% |
| Ecuadorians | 12.6 /100 | #222 | Poor 14.0% |
| Immigrants | South Eastern Asia | 11.9 /100 | #223 | Poor 14.0% |
| Immigrants | Grenada | 11.8 /100 | #224 | Poor 14.0% |
| Portuguese | 11.2 /100 | #225 | Poor 13.9% |
| Immigrants | St. Vincent and the Grenadines | 11.0 /100 | #226 | Poor 13.9% |
| Immigrants | West Indies | 9.8 /100 | #227 | Tragic 13.9% |
| Whites/Caucasians | 9.1 /100 | #228 | Tragic 13.8% |
| British West Indians | 8.8 /100 | #229 | Tragic 13.8% |
Demographics Similar to Immigrants from Uruguay by Master's Degree
In terms of master's degree, the demographic groups most similar to Immigrants from Uruguay are Costa Rican (15.0%, a difference of 0.040%), Immigrants from Ghana (15.0%, a difference of 0.10%), Slovak (14.9%, a difference of 0.36%), Immigrants from Peru (14.9%, a difference of 0.40%), and Irish (15.0%, a difference of 0.46%).
| Demographics | Rating | Rank | Master's Degree |
| Immigrants | Kenya | 66.6 /100 | #165 | Good 15.3% |
| Swedes | 66.1 /100 | #166 | Good 15.2% |
| Senegalese | 65.6 /100 | #167 | Good 15.2% |
| Immigrants | North Macedonia | 64.5 /100 | #168 | Good 15.2% |
| Scottish | 62.7 /100 | #169 | Good 15.2% |
| Irish | 56.3 /100 | #170 | Average 15.0% |
| Immigrants | Ghana | 53.6 /100 | #171 | Average 15.0% |
| Immigrants | Uruguay | 52.8 /100 | #172 | Average 15.0% |
| Costa Ricans | 52.5 /100 | #173 | Average 15.0% |
| Slovaks | 50.0 /100 | #174 | Average 14.9% |
| Immigrants | Peru | 49.6 /100 | #175 | Average 14.9% |
| Nigerians | 48.6 /100 | #176 | Average 14.9% |
| Immigrants | Colombia | 48.3 /100 | #177 | Average 14.9% |
| English | 45.0 /100 | #178 | Average 14.8% |
| Immigrants | Iraq | 41.3 /100 | #179 | Average 14.8% |