Japanese vs Immigrants from Afghanistan Master's Degree
COMPARE
Japanese
Immigrants from Afghanistan
Master's Degree
Master's Degree Comparison
Japanese
Immigrants from Afghanistan
12.5%
MASTER'S DEGREE
0.6/ 100
METRIC RATING
259th/ 347
METRIC RANK
15.6%
MASTER'S DEGREE
79.4/ 100
METRIC RATING
146th/ 347
METRIC RANK
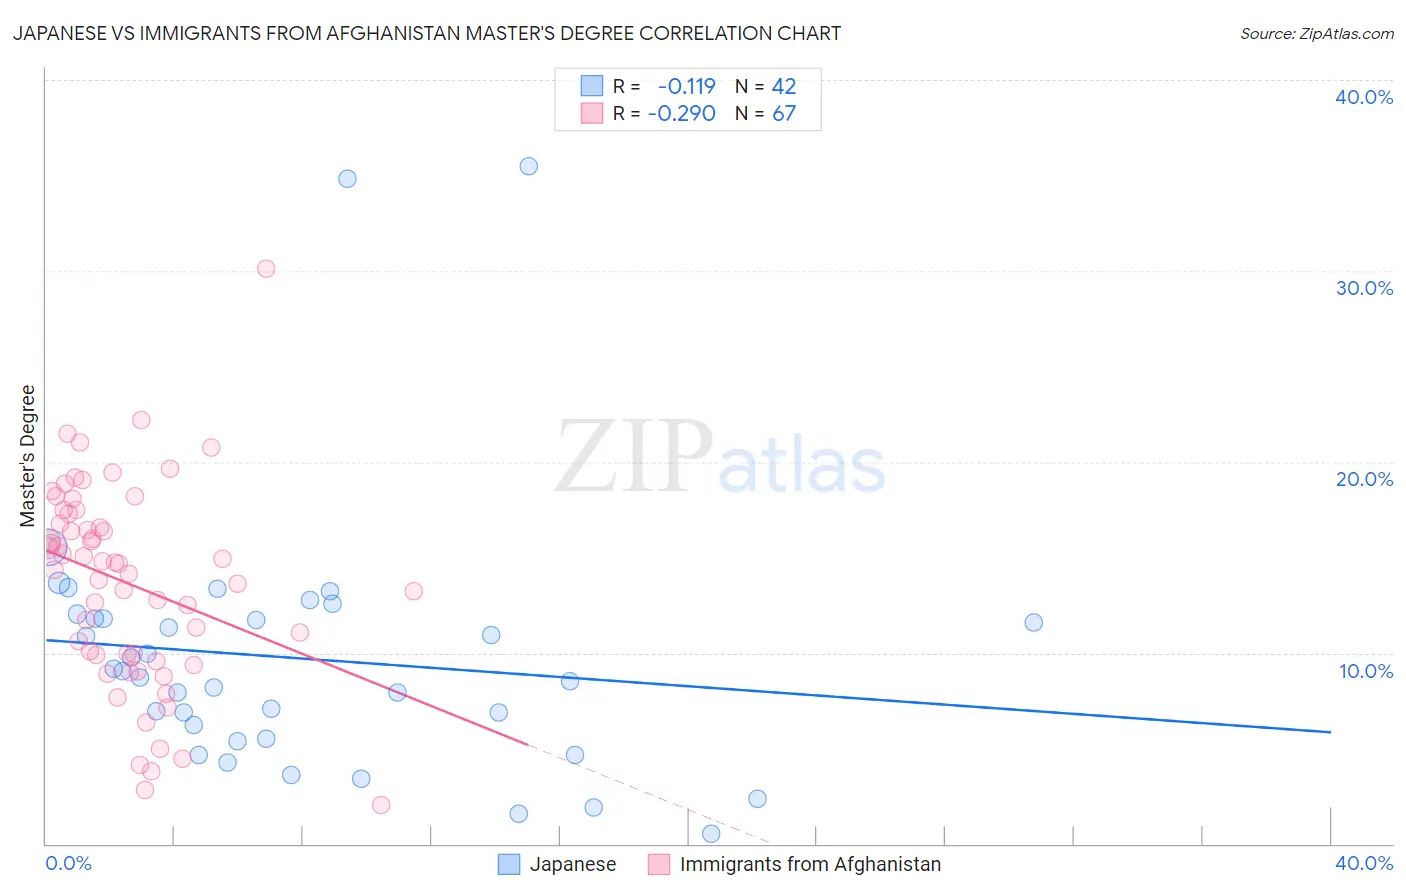
Japanese vs Immigrants from Afghanistan Master's Degree Correlation Chart
The statistical analysis conducted on geographies consisting of 249,128,490 people shows a poor negative correlation between the proportion of Japanese and percentage of population with at least master's degree education in the United States with a correlation coefficient (R) of -0.119 and weighted average of 12.5%. Similarly, the statistical analysis conducted on geographies consisting of 147,637,931 people shows a weak negative correlation between the proportion of Immigrants from Afghanistan and percentage of population with at least master's degree education in the United States with a correlation coefficient (R) of -0.290 and weighted average of 15.6%, a difference of 24.6%.
Master's Degree Correlation Summary
| Measurement | Japanese | Immigrants from Afghanistan |
| Minimum | 0.51% | 2.0% |
| Maximum | 35.5% | 30.1% |
| Range | 35.0% | 28.1% |
| Mean | 9.7% | 13.6% |
| Median | 8.9% | 14.7% |
| Interquartile 25% (IQ1) | 5.5% | 9.9% |
| Interquartile 75% (IQ3) | 11.8% | 17.3% |
| Interquartile Range (IQR) | 6.3% | 7.4% |
| Standard Deviation (Sample) | 6.9% | 5.3% |
| Standard Deviation (Population) | 6.8% | 5.2% |
Similar Demographics by Master's Degree
Demographics Similar to Japanese by Master's Degree
In terms of master's degree, the demographic groups most similar to Japanese are Dominican (12.5%, a difference of 0.010%), Tongan (12.5%, a difference of 0.040%), Immigrants from Liberia (12.5%, a difference of 0.090%), Nicaraguan (12.5%, a difference of 0.23%), and Central American Indian (12.4%, a difference of 0.46%).
| Demographics | Rating | Rank | Master's Degree |
| French American Indians | 1.0 /100 | #252 | Tragic 12.7% |
| Immigrants | Dominica | 0.8 /100 | #253 | Tragic 12.6% |
| Indonesians | 0.8 /100 | #254 | Tragic 12.6% |
| Immigrants | Congo | 0.8 /100 | #255 | Tragic 12.6% |
| Immigrants | Portugal | 0.8 /100 | #256 | Tragic 12.6% |
| Osage | 0.7 /100 | #257 | Tragic 12.6% |
| Immigrants | Liberia | 0.6 /100 | #258 | Tragic 12.5% |
| Japanese | 0.6 /100 | #259 | Tragic 12.5% |
| Dominicans | 0.6 /100 | #260 | Tragic 12.5% |
| Tongans | 0.6 /100 | #261 | Tragic 12.5% |
| Nicaraguans | 0.6 /100 | #262 | Tragic 12.5% |
| Central American Indians | 0.5 /100 | #263 | Tragic 12.4% |
| Belizeans | 0.5 /100 | #264 | Tragic 12.4% |
| Immigrants | Fiji | 0.5 /100 | #265 | Tragic 12.4% |
| Bahamians | 0.5 /100 | #266 | Tragic 12.4% |
Demographics Similar to Immigrants from Afghanistan by Master's Degree
In terms of master's degree, the demographic groups most similar to Immigrants from Afghanistan are Hungarian (15.6%, a difference of 0.040%), Immigrants from Senegal (15.5%, a difference of 0.21%), Ghanaian (15.5%, a difference of 0.22%), Slovene (15.5%, a difference of 0.25%), and South American (15.6%, a difference of 0.37%).
| Demographics | Rating | Rank | Master's Degree |
| Immigrants | Germany | 85.9 /100 | #139 | Excellent 15.8% |
| Vietnamese | 85.5 /100 | #140 | Excellent 15.8% |
| Poles | 85.0 /100 | #141 | Excellent 15.7% |
| Immigrants | Africa | 84.0 /100 | #142 | Excellent 15.7% |
| Immigrants | Venezuela | 83.6 /100 | #143 | Excellent 15.7% |
| Canadians | 83.3 /100 | #144 | Excellent 15.7% |
| South Americans | 81.3 /100 | #145 | Excellent 15.6% |
| Immigrants | Afghanistan | 79.4 /100 | #146 | Good 15.6% |
| Hungarians | 79.1 /100 | #147 | Good 15.6% |
| Immigrants | Senegal | 78.2 /100 | #148 | Good 15.5% |
| Ghanaians | 78.2 /100 | #149 | Good 15.5% |
| Slovenes | 78.0 /100 | #150 | Good 15.5% |
| Iraqis | 77.3 /100 | #151 | Good 15.5% |
| Slavs | 77.0 /100 | #152 | Good 15.5% |
| Icelanders | 76.8 /100 | #153 | Good 15.5% |