Danish vs Immigrants from Uruguay Master's Degree
COMPARE
Danish
Immigrants from Uruguay
Master's Degree
Master's Degree Comparison
Danes
Immigrants from Uruguay
14.5%
MASTER'S DEGREE
31.3/ 100
METRIC RATING
195th/ 347
METRIC RANK
15.0%
MASTER'S DEGREE
52.8/ 100
METRIC RATING
172nd/ 347
METRIC RANK
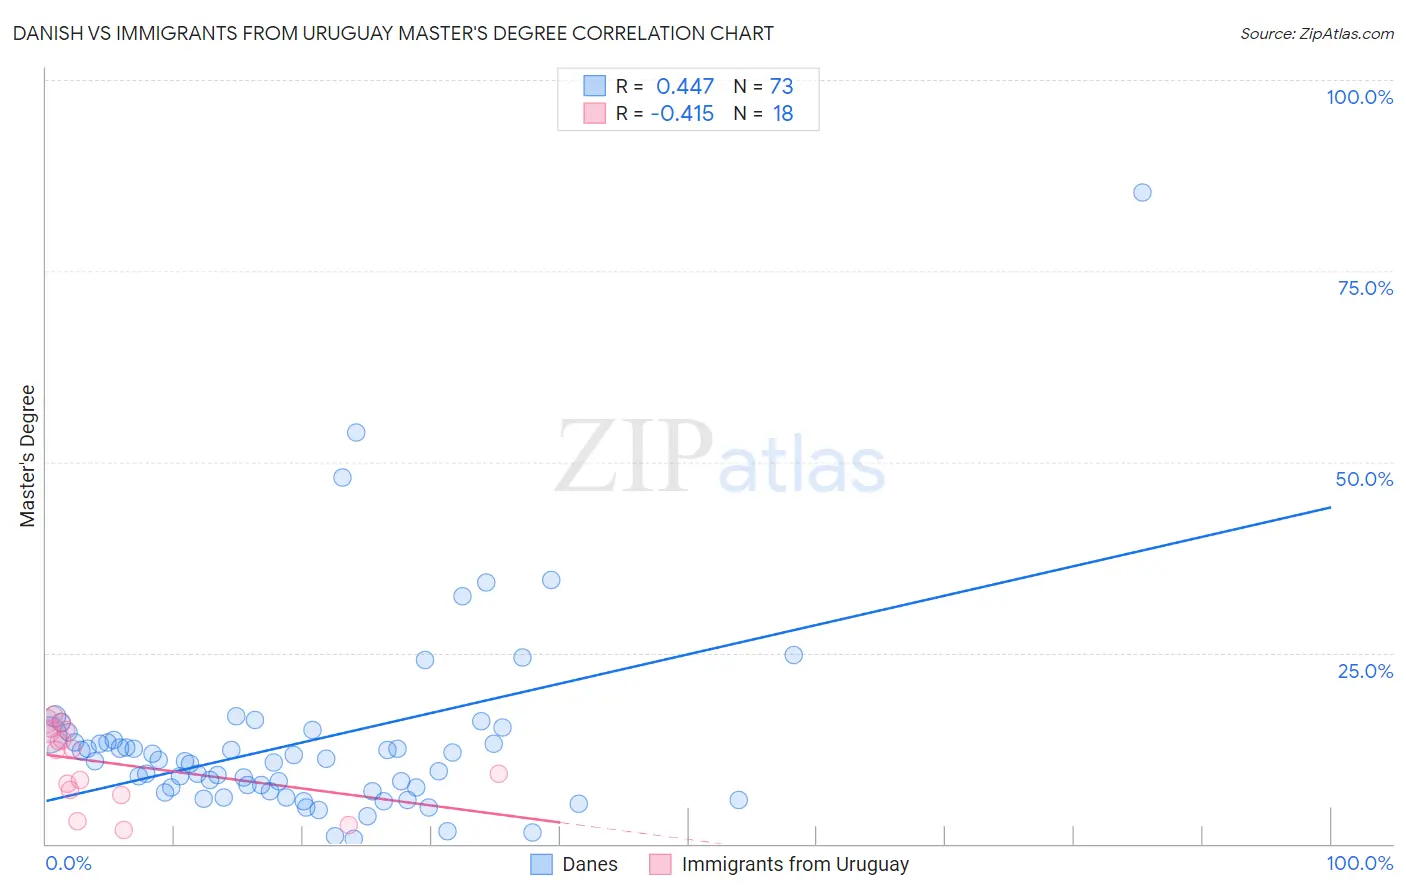
Danish vs Immigrants from Uruguay Master's Degree Correlation Chart
The statistical analysis conducted on geographies consisting of 473,923,988 people shows a moderate positive correlation between the proportion of Danes and percentage of population with at least master's degree education in the United States with a correlation coefficient (R) of 0.447 and weighted average of 14.5%. Similarly, the statistical analysis conducted on geographies consisting of 133,247,285 people shows a moderate negative correlation between the proportion of Immigrants from Uruguay and percentage of population with at least master's degree education in the United States with a correlation coefficient (R) of -0.415 and weighted average of 15.0%, a difference of 2.9%.
Master's Degree Correlation Summary
| Measurement | Danish | Immigrants from Uruguay |
| Minimum | 0.60% | 1.8% |
| Maximum | 85.3% | 16.9% |
| Range | 84.7% | 15.1% |
| Mean | 13.3% | 10.6% |
| Median | 10.8% | 12.3% |
| Interquartile 25% (IQ1) | 6.8% | 7.1% |
| Interquartile 75% (IQ3) | 13.9% | 14.9% |
| Interquartile Range (IQR) | 7.0% | 7.8% |
| Standard Deviation (Sample) | 12.7% | 5.0% |
| Standard Deviation (Population) | 12.6% | 4.8% |
Similar Demographics by Master's Degree
Demographics Similar to Danes by Master's Degree
In terms of master's degree, the demographic groups most similar to Danes are Chinese (14.6%, a difference of 0.18%), Immigrants from Nigeria (14.6%, a difference of 0.22%), Czechoslovakian (14.5%, a difference of 0.22%), Immigrants from Middle Africa (14.6%, a difference of 0.35%), and Welsh (14.6%, a difference of 0.44%).
| Demographics | Rating | Rank | Master's Degree |
| Immigrants | Costa Rica | 36.2 /100 | #188 | Fair 14.7% |
| Immigrants | Immigrants | 36.0 /100 | #189 | Fair 14.6% |
| Spaniards | 35.8 /100 | #190 | Fair 14.6% |
| Welsh | 34.2 /100 | #191 | Fair 14.6% |
| Immigrants | Middle Africa | 33.6 /100 | #192 | Fair 14.6% |
| Immigrants | Nigeria | 32.7 /100 | #193 | Fair 14.6% |
| Chinese | 32.5 /100 | #194 | Fair 14.6% |
| Danes | 31.3 /100 | #195 | Fair 14.5% |
| Czechoslovakians | 29.9 /100 | #196 | Fair 14.5% |
| Belgians | 28.0 /100 | #197 | Fair 14.5% |
| West Indians | 27.4 /100 | #198 | Fair 14.5% |
| Immigrants | Armenia | 27.2 /100 | #199 | Fair 14.5% |
| Panamanians | 25.1 /100 | #200 | Fair 14.4% |
| Scotch-Irish | 25.0 /100 | #201 | Fair 14.4% |
| Immigrants | Western Africa | 24.9 /100 | #202 | Fair 14.4% |
Demographics Similar to Immigrants from Uruguay by Master's Degree
In terms of master's degree, the demographic groups most similar to Immigrants from Uruguay are Costa Rican (15.0%, a difference of 0.040%), Immigrants from Ghana (15.0%, a difference of 0.10%), Slovak (14.9%, a difference of 0.36%), Immigrants from Peru (14.9%, a difference of 0.40%), and Irish (15.0%, a difference of 0.46%).
| Demographics | Rating | Rank | Master's Degree |
| Immigrants | Kenya | 66.6 /100 | #165 | Good 15.3% |
| Swedes | 66.1 /100 | #166 | Good 15.2% |
| Senegalese | 65.6 /100 | #167 | Good 15.2% |
| Immigrants | North Macedonia | 64.5 /100 | #168 | Good 15.2% |
| Scottish | 62.7 /100 | #169 | Good 15.2% |
| Irish | 56.3 /100 | #170 | Average 15.0% |
| Immigrants | Ghana | 53.6 /100 | #171 | Average 15.0% |
| Immigrants | Uruguay | 52.8 /100 | #172 | Average 15.0% |
| Costa Ricans | 52.5 /100 | #173 | Average 15.0% |
| Slovaks | 50.0 /100 | #174 | Average 14.9% |
| Immigrants | Peru | 49.6 /100 | #175 | Average 14.9% |
| Nigerians | 48.6 /100 | #176 | Average 14.9% |
| Immigrants | Colombia | 48.3 /100 | #177 | Average 14.9% |
| English | 45.0 /100 | #178 | Average 14.8% |
| Immigrants | Iraq | 41.3 /100 | #179 | Average 14.8% |