Japanese vs Dominican Master's Degree
COMPARE
Japanese
Dominican
Master's Degree
Master's Degree Comparison
Japanese
Dominicans
12.5%
MASTER'S DEGREE
0.6/ 100
METRIC RATING
259th/ 347
METRIC RANK
12.5%
MASTER'S DEGREE
0.6/ 100
METRIC RATING
260th/ 347
METRIC RANK
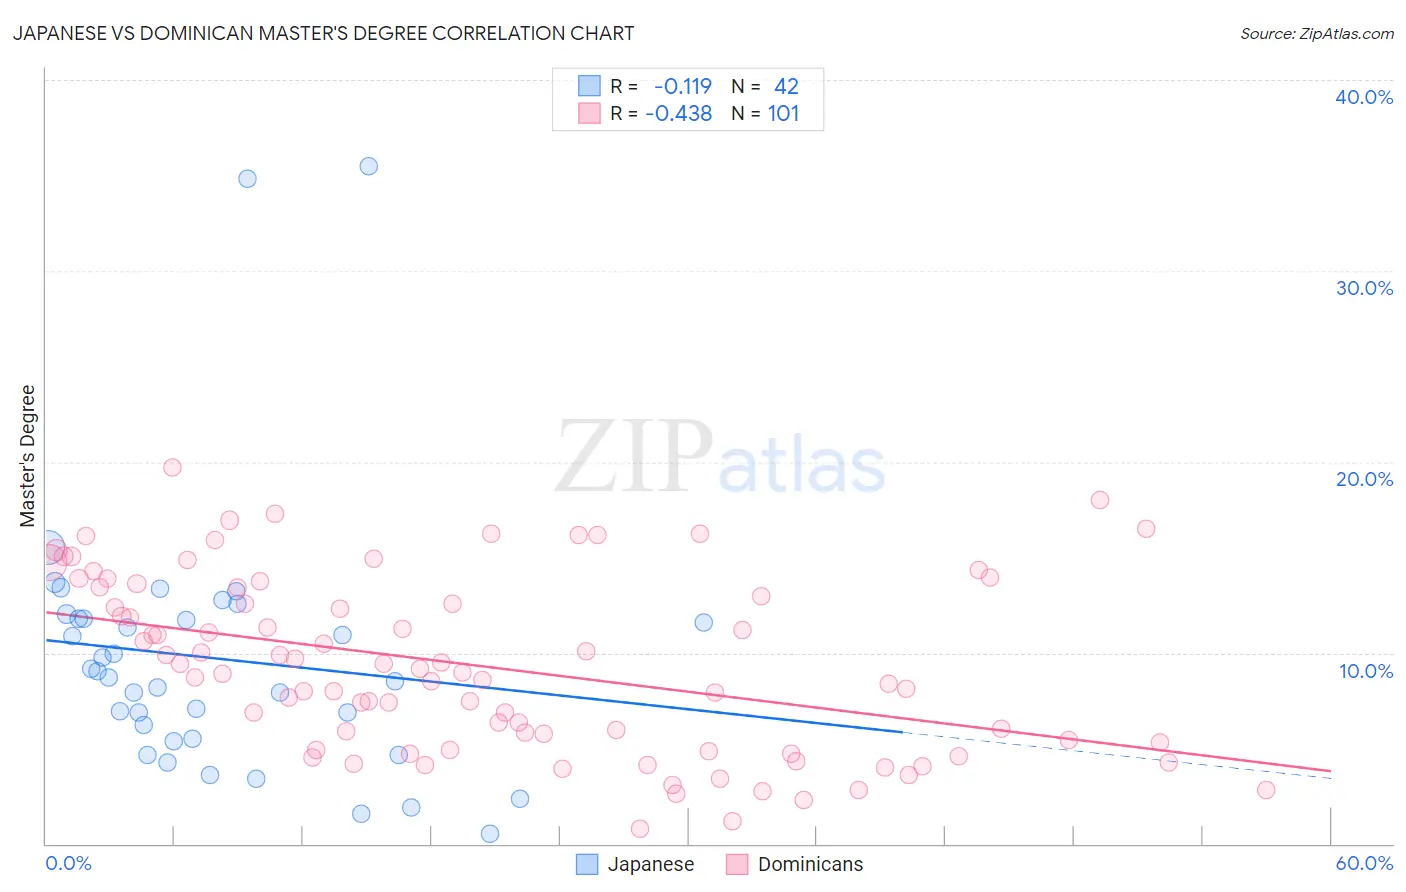
Japanese vs Dominican Master's Degree Correlation Chart
The statistical analysis conducted on geographies consisting of 249,128,490 people shows a poor negative correlation between the proportion of Japanese and percentage of population with at least master's degree education in the United States with a correlation coefficient (R) of -0.119 and weighted average of 12.5%. Similarly, the statistical analysis conducted on geographies consisting of 354,930,218 people shows a moderate negative correlation between the proportion of Dominicans and percentage of population with at least master's degree education in the United States with a correlation coefficient (R) of -0.438 and weighted average of 12.5%, a difference of 0.010%.
Master's Degree Correlation Summary
| Measurement | Japanese | Dominican |
| Minimum | 0.51% | 0.79% |
| Maximum | 35.5% | 19.7% |
| Range | 35.0% | 18.9% |
| Mean | 9.7% | 9.3% |
| Median | 8.9% | 9.0% |
| Interquartile 25% (IQ1) | 5.5% | 5.1% |
| Interquartile 75% (IQ3) | 11.8% | 13.4% |
| Interquartile Range (IQR) | 6.3% | 8.3% |
| Standard Deviation (Sample) | 6.9% | 4.6% |
| Standard Deviation (Population) | 6.8% | 4.5% |
Demographics Similar to Japanese and Dominicans by Master's Degree
In terms of master's degree, the demographic groups most similar to Japanese are Tongan (12.5%, a difference of 0.040%), Immigrants from Liberia (12.5%, a difference of 0.090%), Nicaraguan (12.5%, a difference of 0.23%), Central American Indian (12.4%, a difference of 0.46%), and Osage (12.6%, a difference of 0.59%). Similarly, the demographic groups most similar to Dominicans are Tongan (12.5%, a difference of 0.040%), Immigrants from Liberia (12.5%, a difference of 0.10%), Nicaraguan (12.5%, a difference of 0.22%), Central American Indian (12.4%, a difference of 0.46%), and Osage (12.6%, a difference of 0.59%).
| Demographics | Rating | Rank | Master's Degree |
| Cree | 1.3 /100 | #249 | Tragic 12.8% |
| Liberians | 1.3 /100 | #250 | Tragic 12.8% |
| Tlingit-Haida | 1.3 /100 | #251 | Tragic 12.8% |
| French American Indians | 1.0 /100 | #252 | Tragic 12.7% |
| Immigrants | Dominica | 0.8 /100 | #253 | Tragic 12.6% |
| Indonesians | 0.8 /100 | #254 | Tragic 12.6% |
| Immigrants | Congo | 0.8 /100 | #255 | Tragic 12.6% |
| Immigrants | Portugal | 0.8 /100 | #256 | Tragic 12.6% |
| Osage | 0.7 /100 | #257 | Tragic 12.6% |
| Immigrants | Liberia | 0.6 /100 | #258 | Tragic 12.5% |
| Japanese | 0.6 /100 | #259 | Tragic 12.5% |
| Dominicans | 0.6 /100 | #260 | Tragic 12.5% |
| Tongans | 0.6 /100 | #261 | Tragic 12.5% |
| Nicaraguans | 0.6 /100 | #262 | Tragic 12.5% |
| Central American Indians | 0.5 /100 | #263 | Tragic 12.4% |
| Belizeans | 0.5 /100 | #264 | Tragic 12.4% |
| Immigrants | Fiji | 0.5 /100 | #265 | Tragic 12.4% |
| Bahamians | 0.5 /100 | #266 | Tragic 12.4% |
| Americans | 0.4 /100 | #267 | Tragic 12.3% |
| Native Hawaiians | 0.4 /100 | #268 | Tragic 12.3% |
| Central Americans | 0.3 /100 | #269 | Tragic 12.2% |