Japanese vs Immigrants from Uganda Unemployment Among Seniors over 75 years
COMPARE
Japanese
Immigrants from Uganda
Unemployment Among Seniors over 75 years
Unemployment Among Seniors over 75 years Comparison
Japanese
Immigrants from Uganda
8.3%
UNEMPLOYMENT AMONG SENIORS OVER 75 YEARS
97.5/ 100
METRIC RATING
119th/ 347
METRIC RANK
8.0%
UNEMPLOYMENT AMONG SENIORS OVER 75 YEARS
99.8/ 100
METRIC RATING
75th/ 347
METRIC RANK
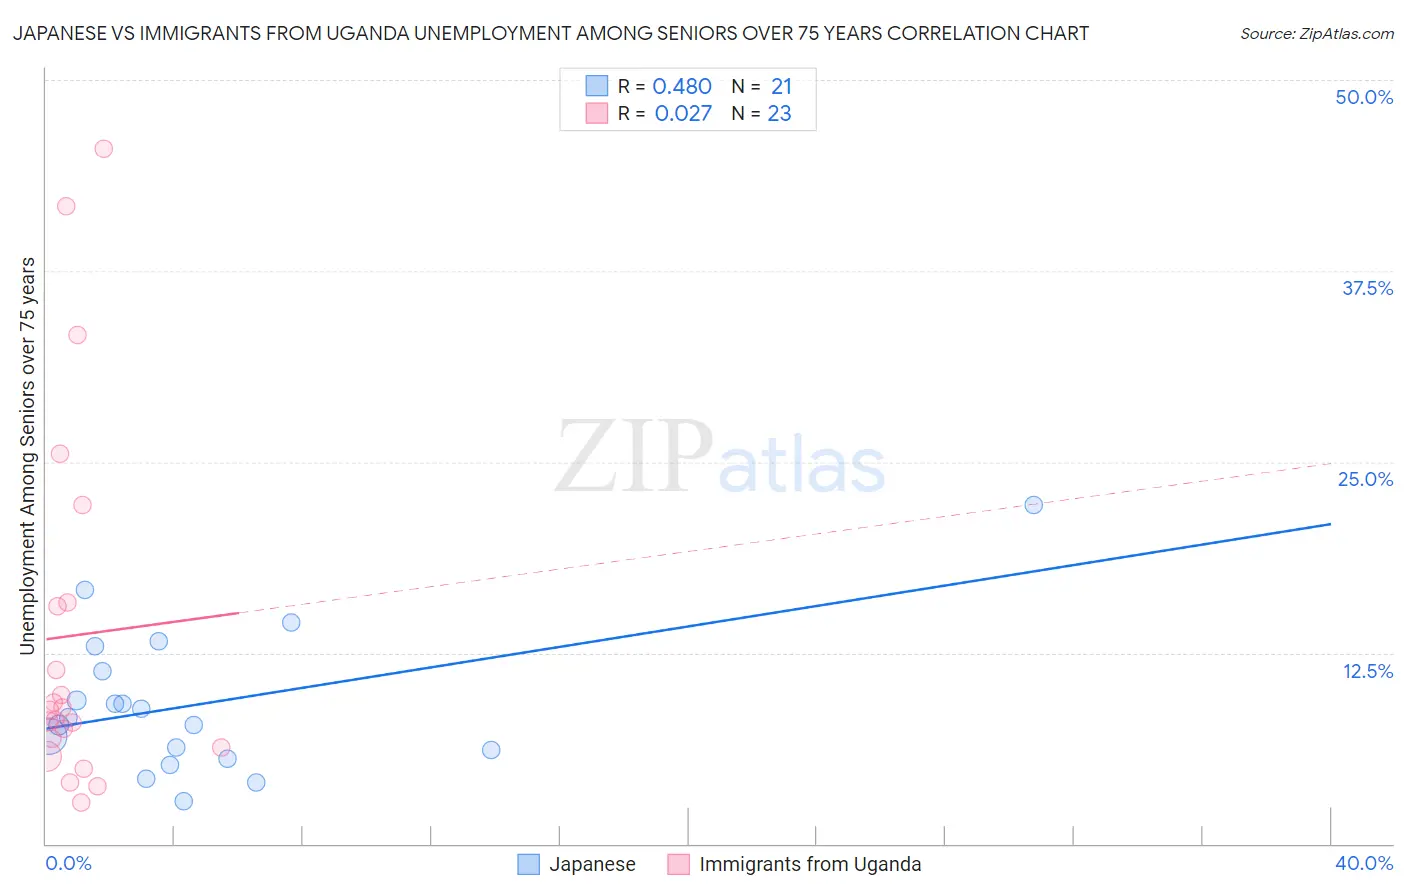
Japanese vs Immigrants from Uganda Unemployment Among Seniors over 75 years Correlation Chart
The statistical analysis conducted on geographies consisting of 149,299,212 people shows a moderate positive correlation between the proportion of Japanese and unemployment rate among seniors over the age of 75 in the United States with a correlation coefficient (R) of 0.480 and weighted average of 8.3%. Similarly, the statistical analysis conducted on geographies consisting of 92,923,219 people shows no correlation between the proportion of Immigrants from Uganda and unemployment rate among seniors over the age of 75 in the United States with a correlation coefficient (R) of 0.027 and weighted average of 8.0%, a difference of 3.8%.
Unemployment Among Seniors over 75 years Correlation Summary
| Measurement | Japanese | Immigrants from Uganda |
| Minimum | 2.8% | 2.7% |
| Maximum | 22.2% | 45.5% |
| Range | 19.4% | 42.8% |
| Mean | 9.2% | 13.6% |
| Median | 8.2% | 8.7% |
| Interquartile 25% (IQ1) | 5.8% | 6.3% |
| Interquartile 75% (IQ3) | 12.1% | 15.8% |
| Interquartile Range (IQR) | 6.2% | 9.5% |
| Standard Deviation (Sample) | 4.7% | 12.0% |
| Standard Deviation (Population) | 4.6% | 11.8% |
Similar Demographics by Unemployment Among Seniors over 75 years
Demographics Similar to Japanese by Unemployment Among Seniors over 75 years
In terms of unemployment among seniors over 75 years, the demographic groups most similar to Japanese are Immigrants from Asia (8.3%, a difference of 0.020%), Immigrants from Croatia (8.3%, a difference of 0.15%), Immigrants from Russia (8.3%, a difference of 0.21%), Immigrants from Middle Africa (8.3%, a difference of 0.27%), and Immigrants from Nepal (8.3%, a difference of 0.29%).
| Demographics | Rating | Rank | Unemployment Among Seniors over 75 years |
| Immigrants | India | 98.6 /100 | #112 | Exceptional 8.2% |
| Asians | 98.5 /100 | #113 | Exceptional 8.3% |
| Trinidadians and Tobagonians | 98.4 /100 | #114 | Exceptional 8.3% |
| Sudanese | 98.2 /100 | #115 | Exceptional 8.3% |
| Immigrants | West Indies | 98.1 /100 | #116 | Exceptional 8.3% |
| Immigrants | Greece | 97.9 /100 | #117 | Exceptional 8.3% |
| Immigrants | Middle Africa | 97.9 /100 | #118 | Exceptional 8.3% |
| Japanese | 97.5 /100 | #119 | Exceptional 8.3% |
| Immigrants | Asia | 97.4 /100 | #120 | Exceptional 8.3% |
| Immigrants | Croatia | 97.2 /100 | #121 | Exceptional 8.3% |
| Immigrants | Russia | 97.1 /100 | #122 | Exceptional 8.3% |
| Immigrants | Nepal | 96.9 /100 | #123 | Exceptional 8.3% |
| Thais | 96.8 /100 | #124 | Exceptional 8.3% |
| Immigrants | Moldova | 96.7 /100 | #125 | Exceptional 8.3% |
| Belizeans | 96.3 /100 | #126 | Exceptional 8.4% |
Demographics Similar to Immigrants from Uganda by Unemployment Among Seniors over 75 years
In terms of unemployment among seniors over 75 years, the demographic groups most similar to Immigrants from Uganda are Immigrants from Venezuela (8.0%, a difference of 0.11%), Immigrants from Turkey (8.0%, a difference of 0.16%), Immigrants from Belarus (8.0%, a difference of 0.19%), Spanish American (8.0%, a difference of 0.35%), and Immigrants from France (8.0%, a difference of 0.39%).
| Demographics | Rating | Rank | Unemployment Among Seniors over 75 years |
| Immigrants | South Africa | 99.9 /100 | #68 | Exceptional 8.0% |
| Indians (Asian) | 99.9 /100 | #69 | Exceptional 8.0% |
| Immigrants | Argentina | 99.9 /100 | #70 | Exceptional 8.0% |
| Immigrants | Cambodia | 99.9 /100 | #71 | Exceptional 8.0% |
| Bolivians | 99.9 /100 | #72 | Exceptional 8.0% |
| Immigrants | France | 99.9 /100 | #73 | Exceptional 8.0% |
| Spanish Americans | 99.8 /100 | #74 | Exceptional 8.0% |
| Immigrants | Uganda | 99.8 /100 | #75 | Exceptional 8.0% |
| Immigrants | Venezuela | 99.8 /100 | #76 | Exceptional 8.0% |
| Immigrants | Turkey | 99.8 /100 | #77 | Exceptional 8.0% |
| Immigrants | Belarus | 99.8 /100 | #78 | Exceptional 8.0% |
| Immigrants | Japan | 99.7 /100 | #79 | Exceptional 8.0% |
| Immigrants | Australia | 99.7 /100 | #80 | Exceptional 8.0% |
| Cubans | 99.7 /100 | #81 | Exceptional 8.0% |
| Bhutanese | 99.7 /100 | #82 | Exceptional 8.0% |